Attribution vs Incrementality 2026: What your ads actually cause


Attribution assigns credit. Incrementality tests causality. If you treat both as the same thing, you build budget decisions on the wrong number.
Meta, Google and analytics tools can show which interactions appeared on a conversion path and how revenue is distributed between them. That is useful. But it does not automatically answer the more important question:
Key takeaway: How many conversions would not have happened without these ads?
That question is what separates attribution from incrementality.
Last reviewed: 26 August 2026. The examples and recommendations apply to DTC setups using Meta, Google, shop or CRM data. Platform features and conversion windows can change.
Attribution and incrementality answer different questions
- Question: Attribution: Which touchpoint gets credit?; Incrementality: What happened because of the ads?
- Basis: Attribution: Observed customer journeys and model rules; Incrementality: Comparison of test and control groups
- Output: Attribution: Distribution of revenue or conversions; Incrementality: Additional conversions, revenue or profit
- Use: Attribution: Assess campaigns, creatives and touchpoints; Incrementality: Test channel and budget impact
- Strength of evidence: Attribution: Assignment; Incrementality: Causal test
Attribution is not useless. It is simply not an automatic answer to a causal question.
Google describes its attribution models as rules or data-driven models that distribute credit across interactions in the conversion path. That can improve optimization. The credit is still an assignment, not a guarantee that the interaction caused the conversion. Google explains current attribution models.
Incrementality works differently. You hold out a comparable part of the audience or randomly assign users to test and control groups. The difference between both groups is the measured lift. Google describes Conversion Lift as a controlled experiment. Meta uses the same core idea with Conversion Lift and describes lift studies as a way to measure campaign impact and calibrate attribution models. Meta Blueprint: Conversion Lift.
Why Meta, Google and your shop tell different stories
The gap is not automatically a tracking error. Often, three systems are simply using three different definitions.
1. Different conversion windows
A click from seven days ago can still count in one system and fall outside the window in another. A view-through conversion can appear in a platform report while your own reporting accepts only a click or UTM assignment.
2. Different timestamps
Platforms can report by touchpoint date. Your shop stores the order on the day it actually happened. Longer decision paths make the comparison even harder.
3. Different data sources
Meta sees part of the ad interaction. Google sees its own touchpoints and models additional conversions depending on the setup. Your shop or CRM knows the orders or leads, but not automatically the full advertising context.
4. Different funnel roles
Meta is meant to create demand. Brand Search captures demand that often already exists. Retargeting sits in between. A model that gives every touchpoint the same job makes reporting convenient and the budget decision worse.
Our operating hypothesis for 2026 is this: Meta has lost part of its signal since iOS. Google can claim more brand and existing demand at the same time. That does not mean every Meta conversion is missing or every brand conversion is worthless. It means no platform dashboard is the business truth on its own.
The quick sanity check: does the total stay the same after a model change?
A model change can move a lot of credit between channels even when total revenue and orders stay identical.
Simple example with 100,000 € in total revenue: In Model A, Meta gets 30,000 €, Google 40,000 € and Direct/Email 30,000 €. In Model B, Meta gets 45,000 €, Google 25,000 € and Direct/Email remains at 30,000 €.
The 15,000 € did not appear from nowhere. It moved between channels.
That is an allocation check, not an incrementality test. If the total is conserved, you know the model answers “who gets credit?” differently. It does not answer “what would have happened without ads?”
That is why an attractive model comparison often gives no real budget answer. A channel can look stronger in the new model without total revenue or new-customer volume increasing.
First-hand observation: same business, different credit
In an anonymized one-week account analysis, net revenue (42,806 €) and orders (753) stayed identical under two attribution models. Only the credit assigned to the channels moved. That is a warning signal for reporting, not proof for or against the incrementality lift of a single channel. These figures are from one account analysis, not a benchmark.
Which number should control which decision?
Give each number a clear job: platform data for ads, the business view for channel budgets, and experiments for questions about additional impact.
At ad level: use platform numbers
Meta optimizes delivery against its own signal. Evaluate creatives, ads and campaigns inside the platform first.
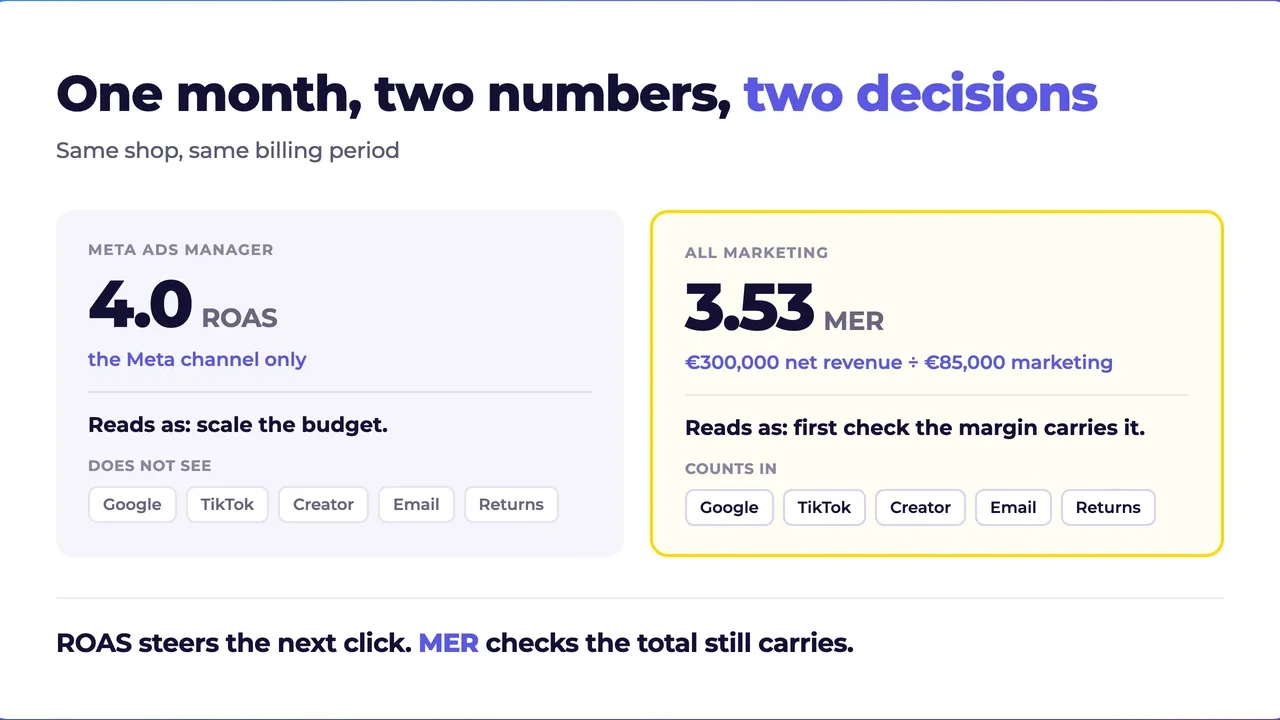
If you optimize a Meta account against a completely different external number, you are working against the bidding mechanism. Platform ROAS can remain useful as an ad-level ranking signal even when its absolute level is not your business truth.
The creative testing guide shows how to turn this into a testing system.
At channel level: use a neutral view and backend data
Do not shift budget between Meta, Google, TikTok and other channels based on three isolated platform ROAS values. At minimum, you need:
- revenue and orders from the shop or CRM
- one consistent cost base
- new-customer share
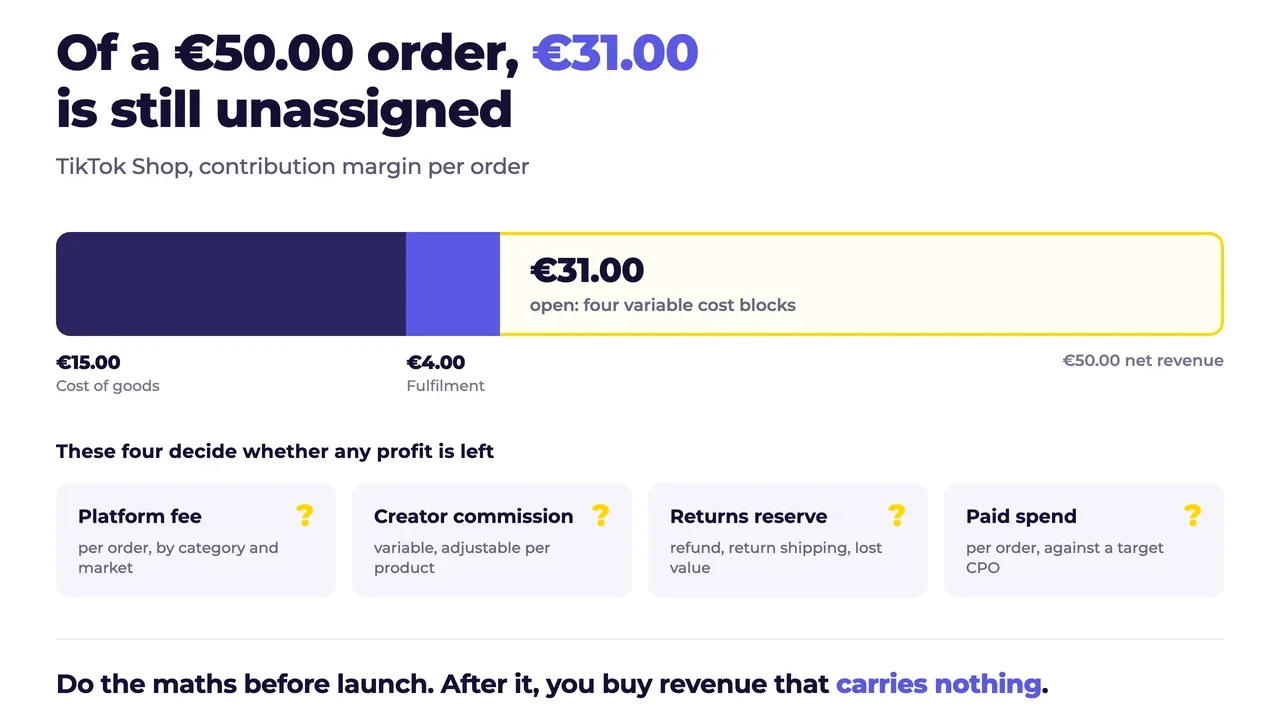
- returns and variable costs
- consistent touchpoint assignment
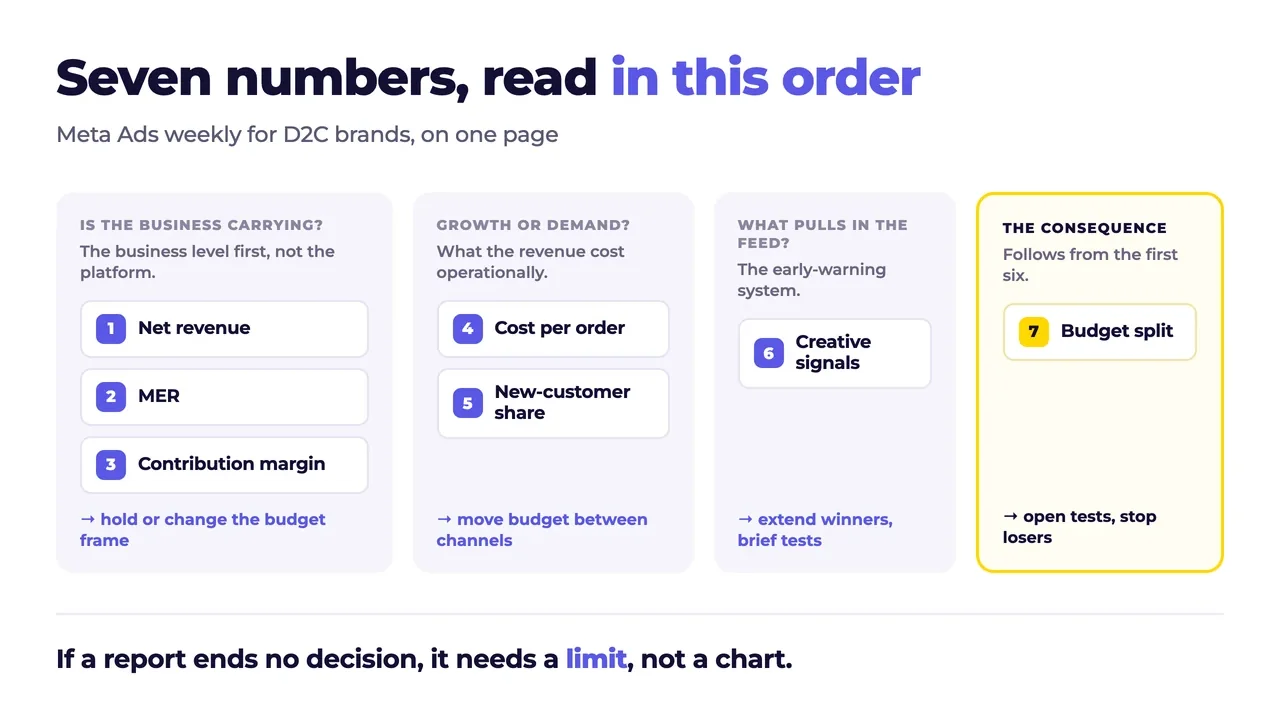
The Meta ads reporting guide shows the order for the weekly review. The business view belongs in MER and contribution margin, not only in Ads Manager.
At business level: profit over platform ROAS
The central question is not: “Which platform reports the highest ROAS?”
It is: “Which investment creates additional demand that still pays after product cost, returns, discounts and marketing?”
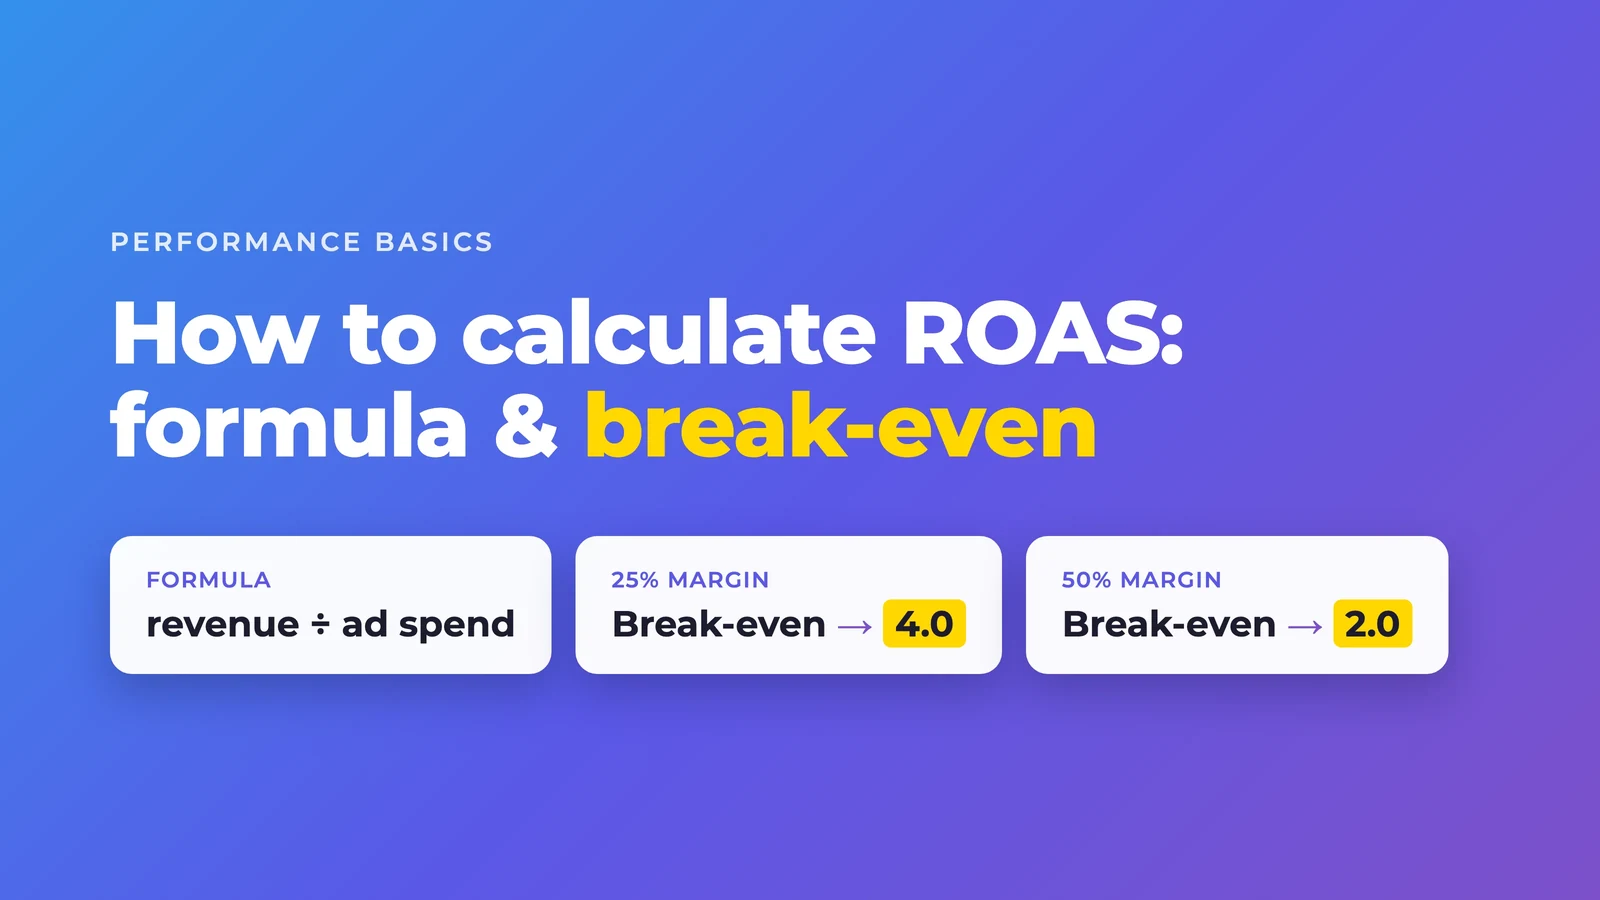
You need a clean break-even ROAS calculation and a business view of the total. Platform credit is an input. Profit is the guardrail.
When you need an incrementality test
You do not need a large experiment for every creative decision. For major budget decisions, you should know where attribution stops being enough.
A test is especially useful when:
- a channel looks extremely profitable inside its own platform, but total revenue does not grow;
- Brand Search or retargeting carries a large share of reported revenue;
- a model change moves credit heavily without showing new demand;
- you want to pause, double or permanently reallocate a channel budget;
- your decision sits inside the break-even corridor.
Option 1: Platform lift
Meta Conversion Lift and Google Conversion Lift split audiences into test and control. You get an estimate of additional conversions or revenue.
This is closer to causality than a normal attribution report. The study is still tied to the platform, its setup and its data quality. Read it as an experiment, not as a magical new truth.
Option 2: Geo test
Hold a channel back in comparable regions and compare the development with similar test regions. This can work when user-level tracking is incomplete. The regions still have to be genuinely comparable. A weak control market turns the test into another story.
Option 3: Brand pause or budget step
Stable accounts can use a controlled brand-pause test or a documented budget step. Define these before the test:
- primary metric
- test duration
- comparison period
- expected direction
- stop rule
- decision after the test
Do not jump to a result after three days because the number looks good. That does not measure lift. It measures hope.
What your shop and CRM need to provide
The base count of conversions comes from the system that creates the conversion.
- In e-commerce, that is the shop or ERP.
- In lead generation, that is the CRM.
Your first-party pixel does not create additional leads or orders. It improves the assignment for conversions that already exist.
That is the difference between measurement and attribution: first establish how many orders or leads actually happened. Then assign them to channels.
If you report only pixel conversions, you miss everything that happened before installation or outside tracking. If you add platform numbers without checking them, you may count the same conversion more than once.
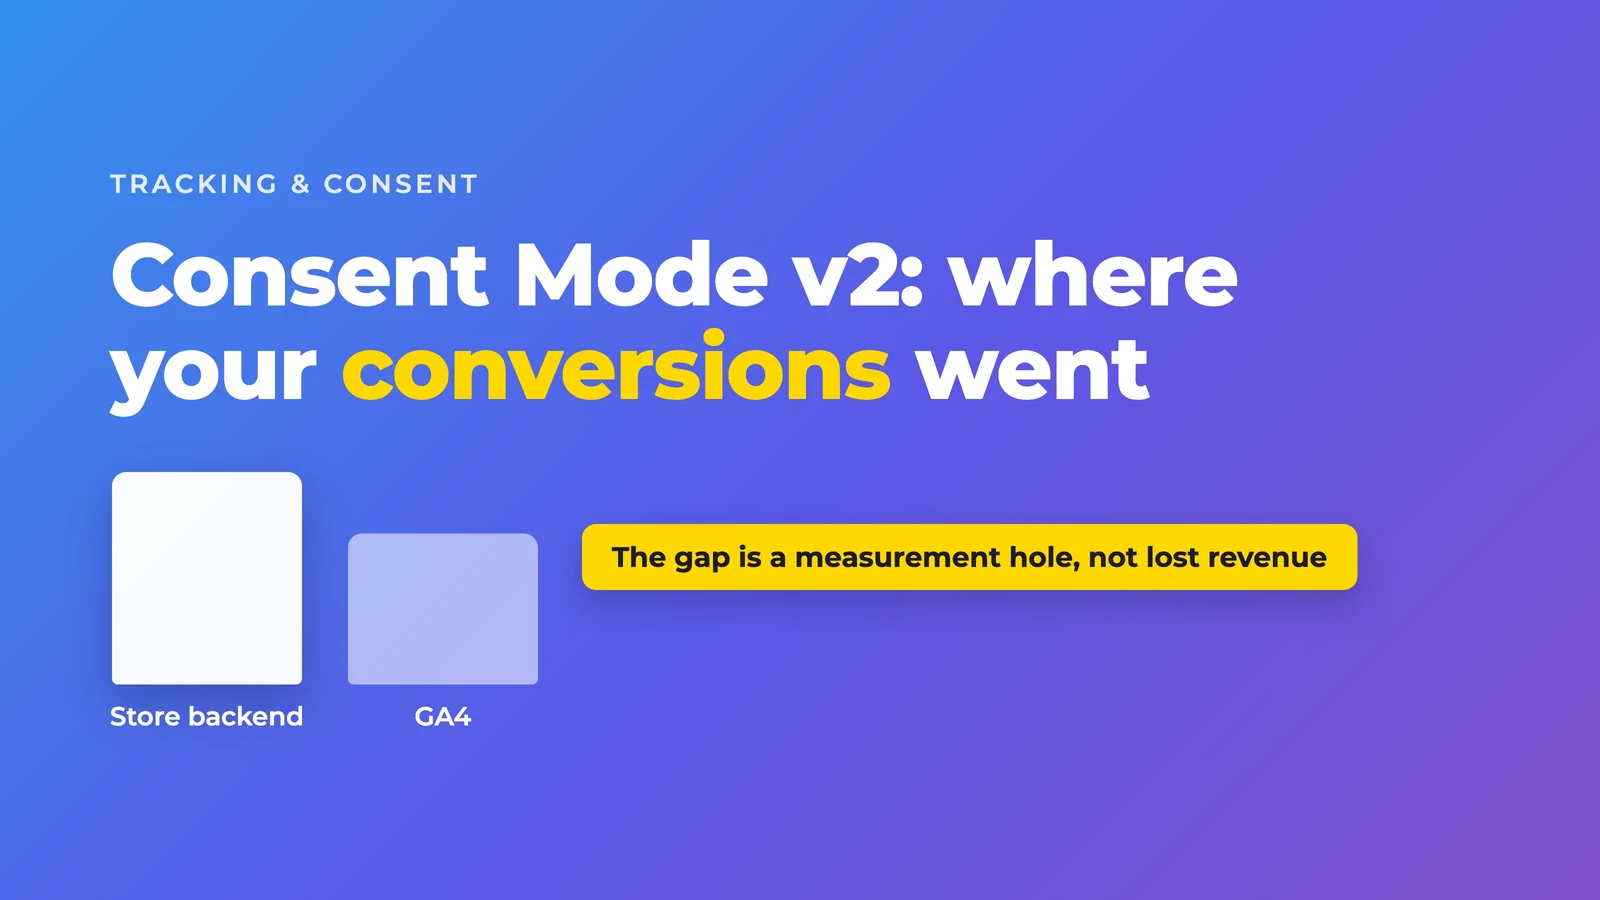
For the technical foundation, see server-side tracking and Conversion API and the Consent Mode v2 guide. Clean tracking does not solve every causal question. It prevents you from starting with the wrong base count.
Where nod. fits into this logic
If you do not want to assemble shop, ad accounts and first-party data manually every week, nod. Performance brings these layers into one profit view.
Keep the distinction clear: a first-party pixel can make the channel view cleaner and more complete. It does not turn modeled attribution into proven incrementality.
The useful order is:
- reconcile orders and revenue with the shop or CRM;
- assign touchpoints with pixel, UTMs and fallback rules;
- keep platform numbers for ad-level optimization;
- read channel values as a range, not false precision;
- use lift or geo tests for major causal questions.
This keeps clear what is measured, what is assigned and what is only modeled.
If you want to connect these layers in one setup, growth strategy is the right starting point.
The short decision logic for your weekly review
- Question: Which ad gets more or less budget?; Number or method: Platform data, creative signals, CPO
- Question: Which channel gets more budget next month?; Number or method: Shop/CRM, neutral channel view, MER, contribution margin
- Question: Does the channel create additional demand?; Number or method: Lift test, geo test or controlled holdout
- Question: Does the marketing operation pay off?; Number or method: Net revenue, MER and profitability
- Question: Is the data complete?; Number or method: Shop/CRM reconciliation, pixel, UTMs and fallback rules
If you mix these questions, every number becomes an argument. Separate them and reporting becomes steerable again.
Conclusion: attribution shows you where to look
Attribution shows which touchpoints appear in observed journeys and how a model distributes credit.
Incrementality shows which additional impact your ads create versus a control group.
Both belong in a good measurement setup. They do not use the same label or answer the same decision.
The robust rule for 2026 is:
Key takeaway: Platform data ranks ads. A neutral business view levels channels. Experiments test causality.
Turning this into one ROAS number makes reporting easier and the decision worse.
Frequently asked questions about attribution and incrementality
Is attribution useless then?
No. Attribution helps you analyze touchpoints, compare creatives and steer campaigns inside a platform. It is not an automatic causal proof.
Is incrementality always better than attribution?
For the question of additional impact, yes. An experiment is not needed for every operational ad decision. Use platform data for ranking and incrementality tests for major channel and budget decisions.
Is Google data-driven attribution enough?
It is a data-driven attribution approach and can be better than pure last click. It still distributes credit across conversion paths. For causality, you need a controlled test.
What if there is not enough data for a lift test?
Work with a transparent range, mark the confidence as low and keep collecting data. Do not invent a precise incrementality number because a dashboard needs one.
Which number should I check first on Monday?
Net revenue, MER and contribution margin show how the business is performing. CPO, new-customer share and creative signals help explain the next operational decision. The Meta ads weekly framework walks through the order.
Sources












Klären wir deinen nächsten Schritt zusammen
Let’s work out your next step together