Meta ads reporting: 7 metrics for your weekly review
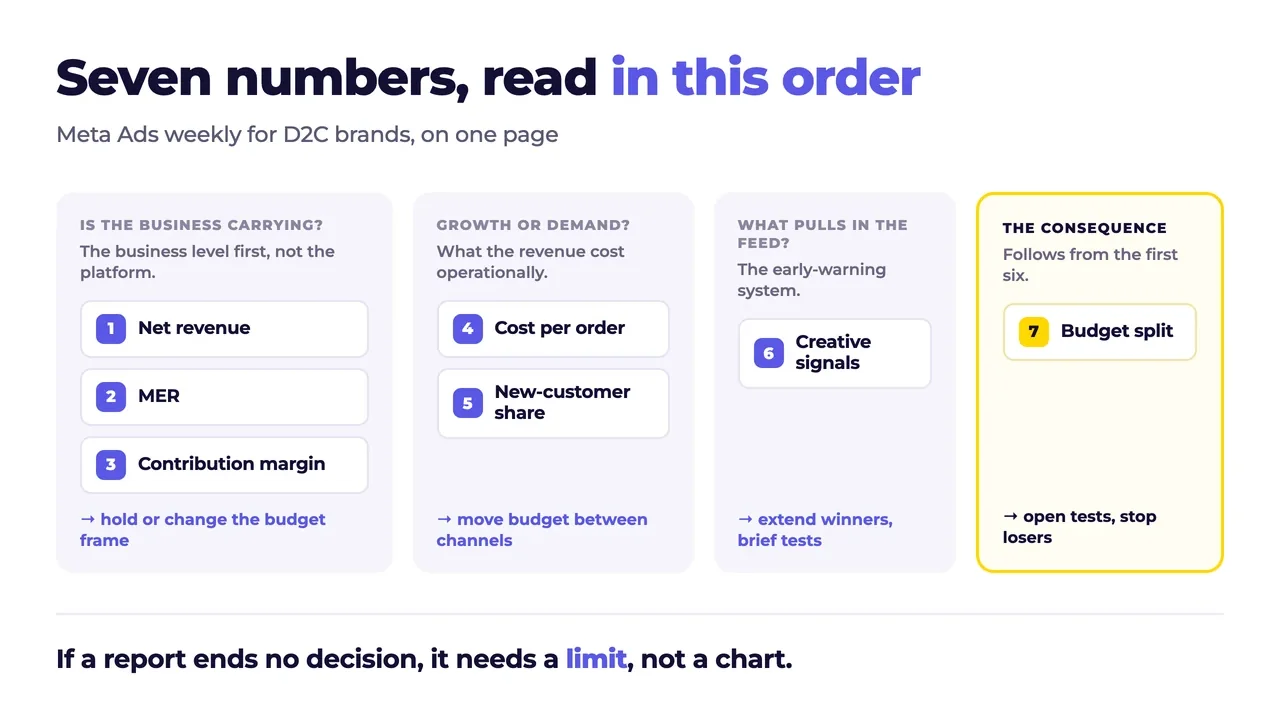

A Meta report should help you make the next decision. More numbers in the dashboard are not enough.
A DTC weekly review starts with revenue, costs and what remains. Then review campaigns and creative. Here are seven metrics and a completed hypothetical example. It contains no client data and shows no Mesper results.
Define the data basis before comparing results
Record the period, time zone, currency and export date. Compare complete weeks using the same definitions. Seven, 14 and 30 days help provide context. Label provisional returns and pending purchases.
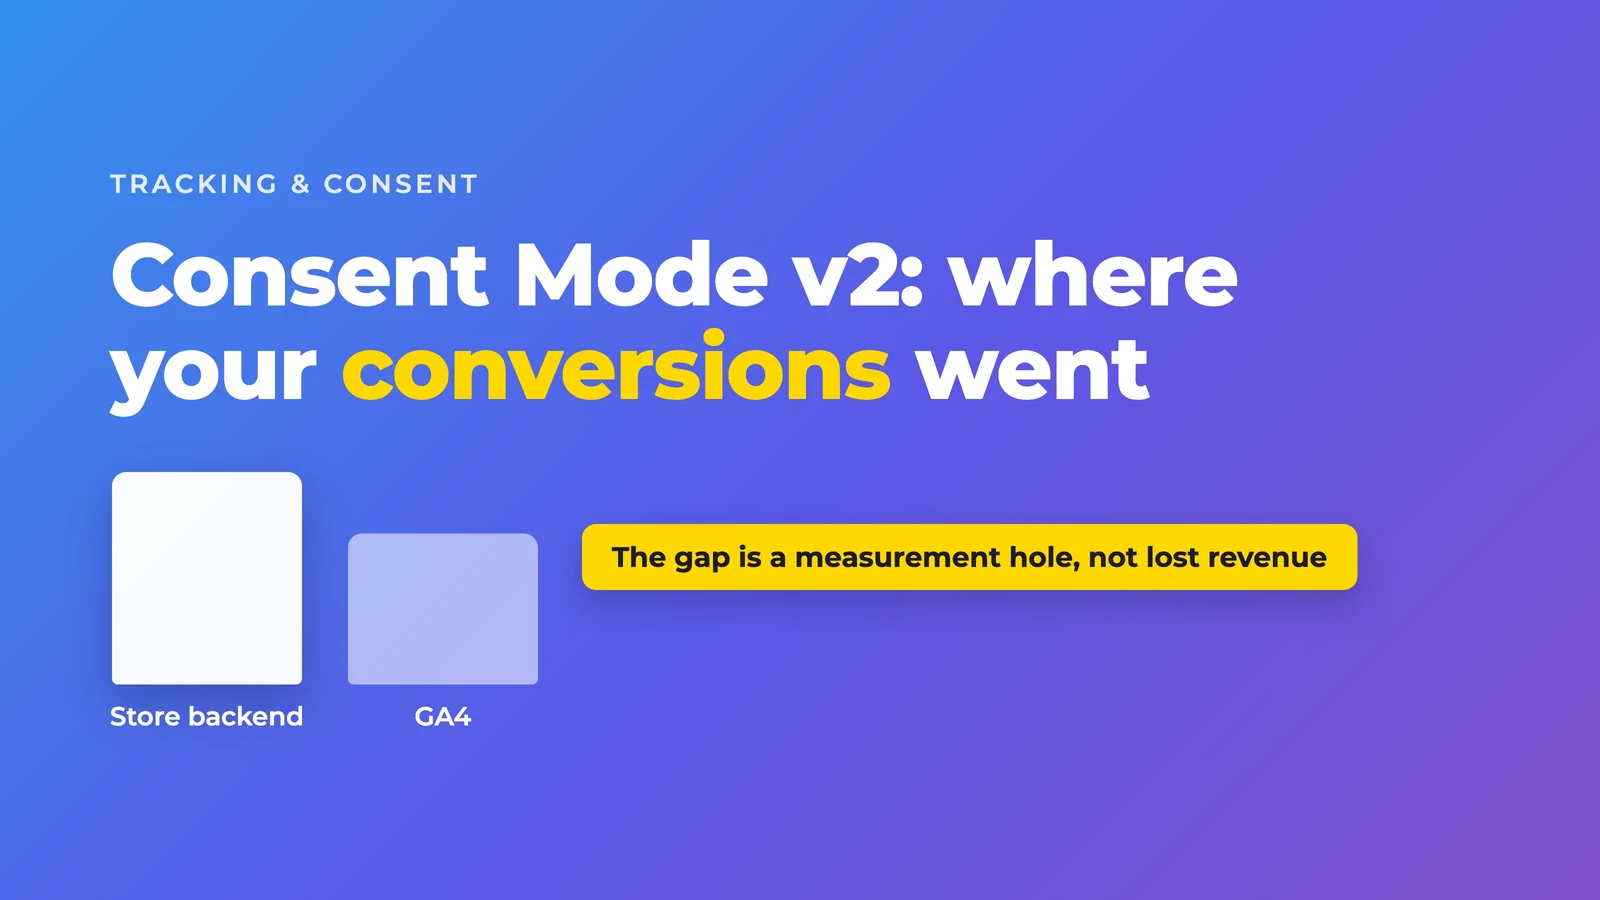
The shop backend supplies orders and net revenue by order date. Ads Manager supplies spend and attributed results according to the selected report. Record the conversion event, attribution, time assignment and data freshness. Do not blindly reconcile individual days across both systems. A later purchase can relate to an earlier ad interaction.
Meta announced changes to click and engagement attribution categories in 2026. Note any definition change before interpreting a jump as improved or worse performance. See Meta's measurement announcement of 3 March 2026 for the background. Check the account to establish which setting is active.
The seven metrics in the weekly report
1: Net revenue
Use revenue excluding VAT and after discounts, cancellations and returns. If current-week returns are not final, disclose the estimate and later correction. Separate total shop revenue from attributed Meta revenue. Do not add revenue attributed by different platforms to shop revenue.
2: Marketing efficiency ratio
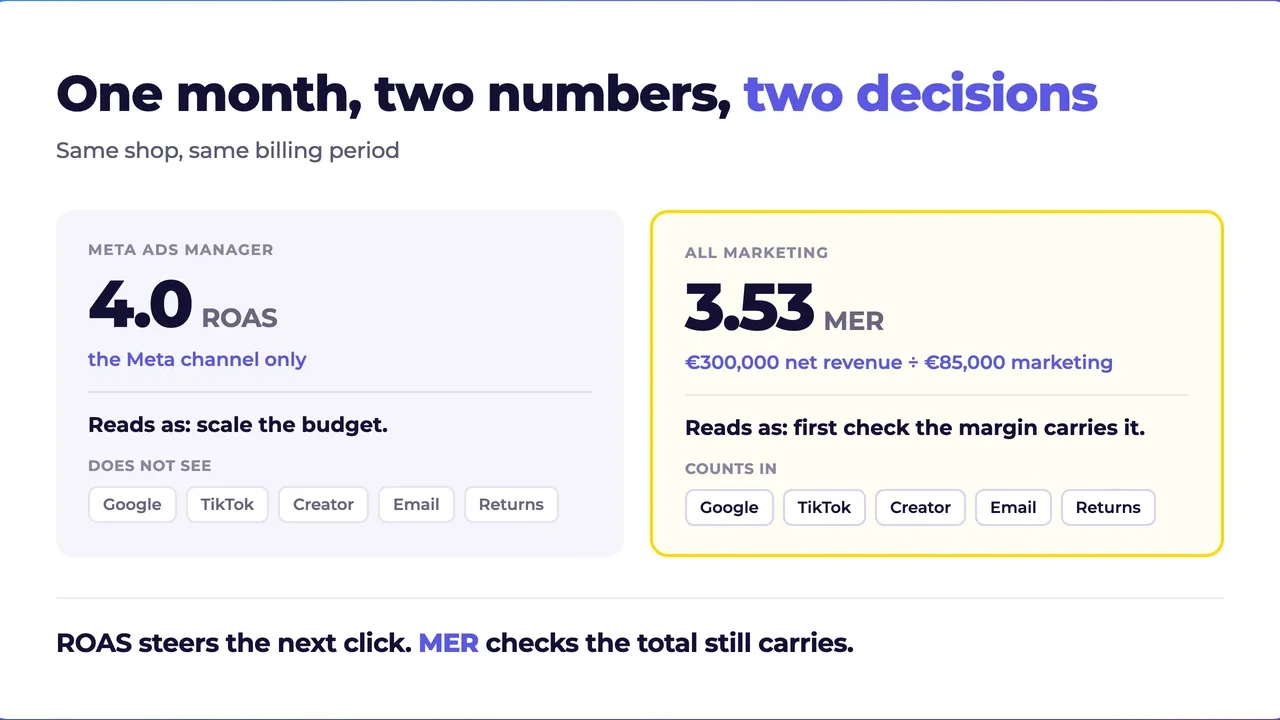
MER = net revenue divided by all defined marketing costs in the same period. This article includes media across channels, creative production, agency and other marketing costs. Allocate monthly costs to weeks under a documented rule. Book creator commissions either here or under variable costs, never twice.
Net revenue divided by media alone is called media MER in this report. The separate name keeps the cost basis visible. See the MER guide for the details.
3: Contribution after marketing
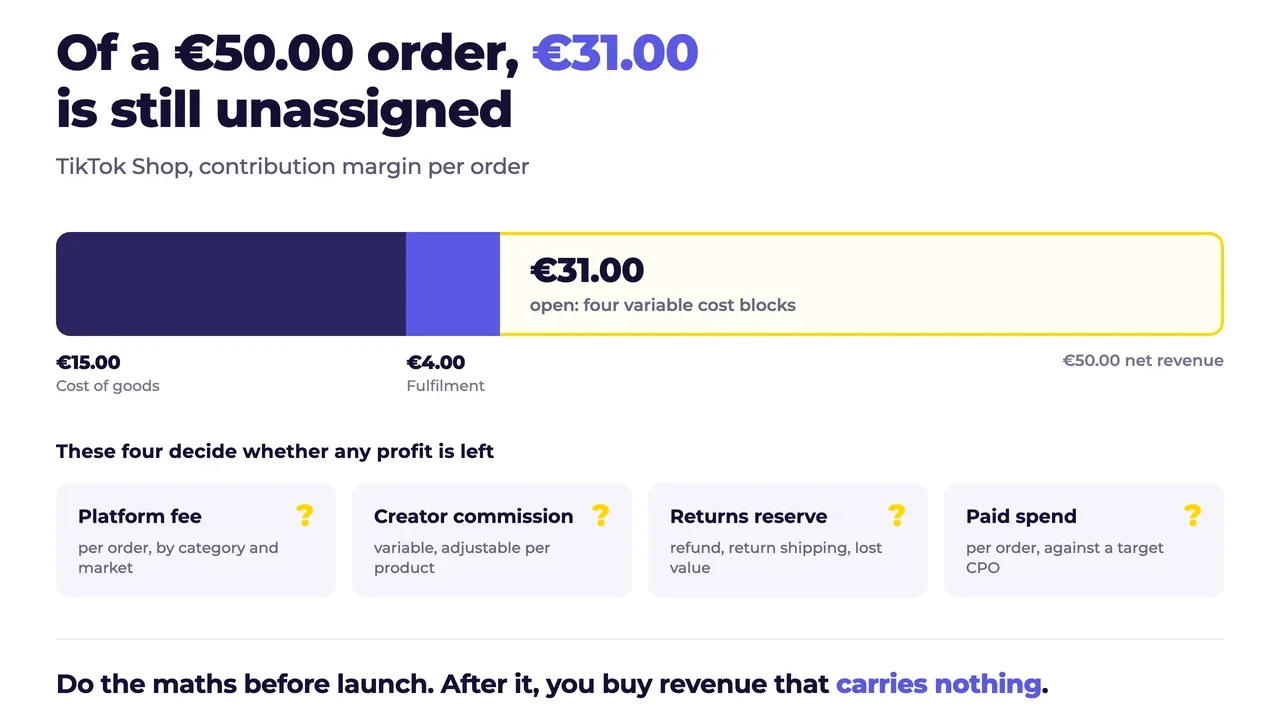
Net revenue minus product costs minus other variable costs minus defined marketing costs. Use the same marketing scope for MER and contribution. The remaining contribution still has to cover other business costs. It is not company profit.
4: Cost per order
Meta CPO = Meta spend divided by attributed Meta orders. Do not use all shop orders as the denominator. Total media divided by all shop orders is a different metric. CPA also requires a conversion definition. New-customer CAC counts new customers and is calculated separately.
Target CPO follows from margin, cost scope and desired contribution. A target for all orders is not automatically the target for prospecting or new customers. The profit planner is the appropriate next step for your cost basis.
5: New-customer share
Define new customers using previous order history in the shop or CRM. Order-based new-customer share = first orders divided by all defined shop orders, multiplied by 100. In this example, an order from a customer without an earlier order counts as a first order. Resolve duplicate customer records before reporting.
This shop metric describes the business mix. It does not prove how many new customers Meta caused. A Meta-specific allocation needs separately documented attribution. A falling share can also result from more repeat purchases. Read the absolute number of first orders too.
6: Creative signals
Show spend, orders and CPO for the main ads. Add link CTR and, for suitable videos, a defined hook or hold rate. The creative testing framework contains the formulas. Static ads do not get a video rate.
Click and video rates support diagnosis. They do not establish additional demand or prove purchase intent. CPM can also change with auction conditions, placement and audience. State the observation first, then a testable hypothesis.
7: Budget distribution
Show spend shares for existing ads, new tests and separately managed campaign roles. The total must reconcile with channel spend. High spend alone does not make an ad profitable. A testing campaign does not guarantee that each ad received a meaningful test.
A completed hypothetical D2C weekly report
All figures below are hypothetical and are not benchmarks. Two complete seven-day weeks, with the same time zone and currency. Net figures include a consistently applied returns estimate. Both Meta exports use the same documented attribution. Purchase delay has been checked. Recently attributed orders may still change.
This hypothetical brand's limits: at least €5,000 in weekly contribution after marketing, Meta CPO no higher than €30, and no increase to total media budget without another margin check. These are deliberately set targets for this example.
- Net revenue: €30,000 last week and €33,000 this week. Up 10%. Shop orders rise from 375 to 412, with net AOV remaining around €80.
- Marketing costs: €10,000 in both weeks. Meta €6,000, Google €2,000, creative €1,000, agency and other marketing costs €1,000. Total media: €8,000.
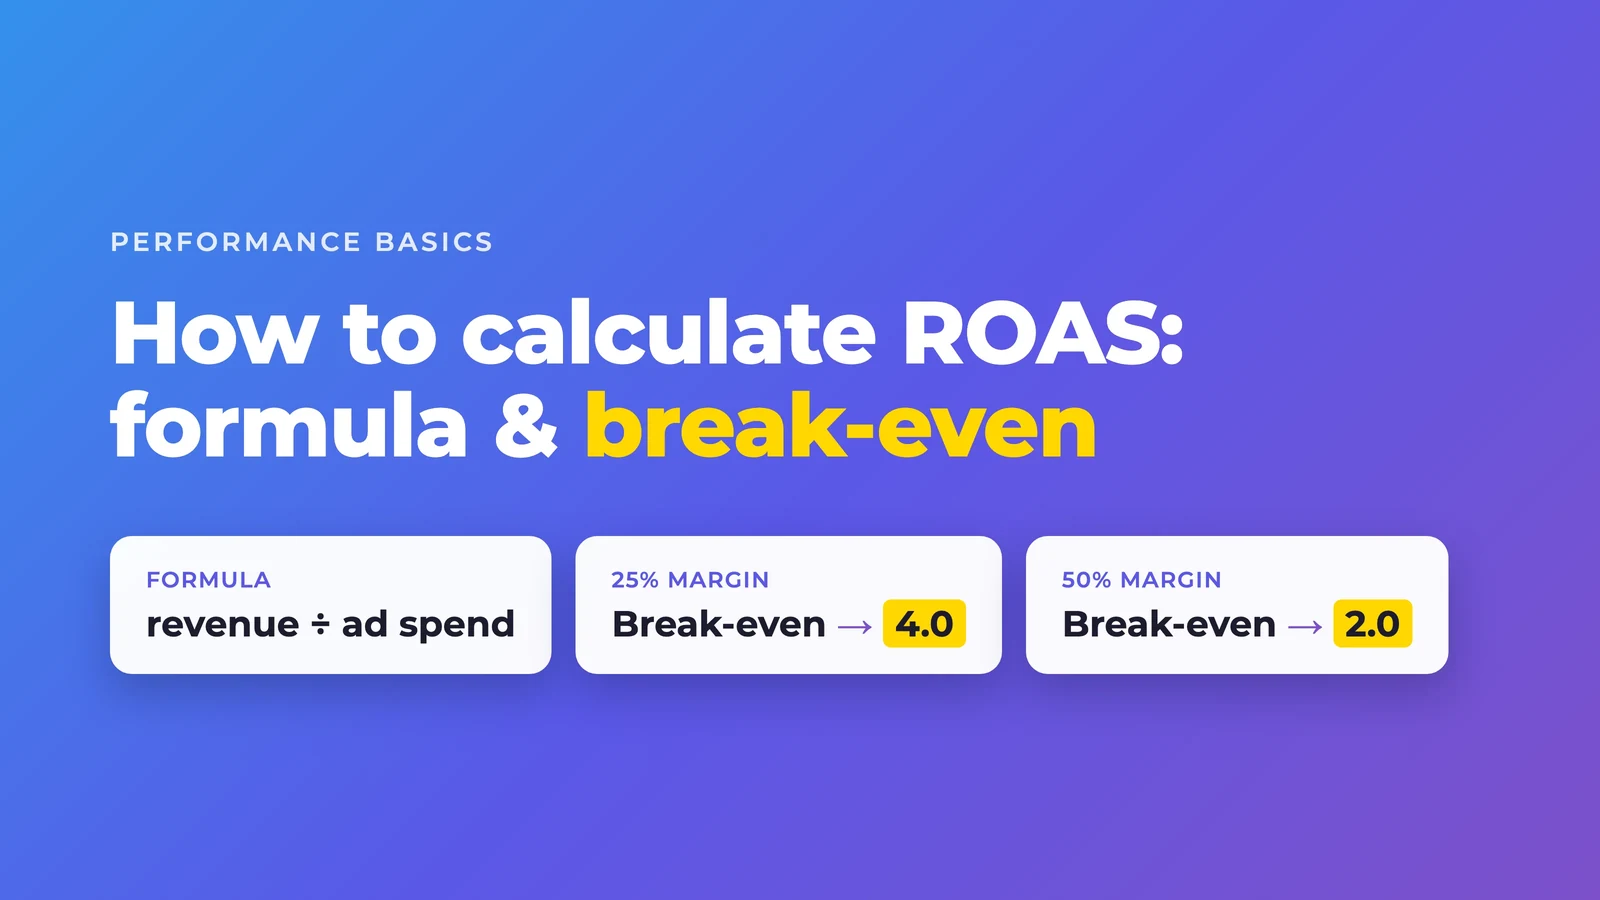
- MER: €30,000 divided by €10,000 = 3.0 last week. This week, €33,000 divided by €10,000 = 3.3. Media MER is separately 3.75 and 4.125.
- Contribution after marketing: Last week, €30,000 minus €10,000 product costs minus €5,000 other variable costs minus €10,000 marketing = €5,000. This week, €33,000 minus €11,000 minus €5,500 minus €10,000 = €6,500. Other fixed business costs have not yet been deducted.
- Meta CPO: Last week, €6,000 divided by 200 attributed orders = €30. This week, €6,000 divided by 220 = €27.27. Below this example's target.
- Shop new-customer mix: First orders rise from 150 to 160. Their share still falls from 40% to 38.8% because total orders grow faster. More first orders with a smaller share is not a contradiction.
Diagnosis: Net revenue and contribution rise at the same marketing budget. The brand exceeds its contribution floor. Meta CPO improves in the documented report. Shop new-customer share falls slightly, while the absolute number of first orders rises.
What this does not tell us: The report does not prove that Meta caused the revenue increase. An email send, repeat purchases, seasonality or another channel may have contributed. Better attributed CPO is an operating signal, not evidence of incrementality. The attribution vs. incrementality guide explains the distinction.
Creative review: top spenders and decisions
In the current hypothetical week, €6,000 in Meta spend splits into €4,800 on existing ads and €1,200 on two new tests. That is 80% and 20%. This distribution is an example allocation.
- Ad A, existing product demonstration: €1,800 spend, 30% of Meta spend, 70 orders, €25.71 CPO. Keep. Candidate for a limited next budget step.
- Ad B, existing evidence: €1,400, 23.3%, 50 orders, €28 CPO. Keep. No new variant without a specific unresolved question.
- Ad C, existing angle: €1,000, 16.7%, 30 orders, €33.33 CPO. Do not increase. Check 14- and 30-day context, product mix and margin.
- Ad D, new demonstration test: €800, 13.3%, 30 orders, €26.67 CPO. Continue evaluating. Document the control comparison and new-customer mix.
- Ad E, existing ad: €600, 10%, 30 orders, €20 CPO. Keep. Lower spend and a different delivery mix prevent a direct winner comparison with A.
- Ad F, new test: €400, 6.7%, ten orders, €40 CPO. Stop the current version because it reached the agreed hypothetical test cap at excessive cost.
The five largest spenders, A to E, account for 93.3% of Meta spend. All six ads total €6,000 and 220 attributed orders. Calculate channel CPO from those totals. A simple average of the six ad CPOs would be wrong.
Three working inputs: A, B and D sit below target in the current window. Downers: F exceeds target, and C does too. Checking that a campaign is active is not enough. Check which ads are actually active and delivering.
Monday's action block
- Hold budget: The performance lead keeps total media at €8,000. A positive weekly report does not justify an automatic increase.
- Stop F: The media buyer pauses this version after the data check. Its planned budget is reallocated for the next period.
- Give A limited additional room: Plan €1,980 instead of €1,800 for the next comparable period. The additional €180 comes from F's previous allocation. This is a hypothetical 10% increase, not a platform rule. Monitor actual spend and CPO.
- Park €220 for testing: The remainder of F's previous allocation stays reserved until the new brief is ready. The plan contains €5,780 in active allocations plus €220 reserve = €6,000 Meta budget.
- Investigate F: By Tuesday, the creative lead checks the hypothesis that the opening and destination create different expectations. A new variant receives a named test brief only after that check.
- Review again: At the next weekly review, check CPO, spend, contribution, absolute first orders and pending purchases. Act immediately on technical defects or missing stock.
Planned budget values do not promise that each ad receives exactly that spend. The next report shows plan and actual delivery. This makes the decision reviewable.
Frequently asked questions about Meta ads reporting
Is Ads Manager enough for a weekly report?
It provides the operating Meta view. Business decisions also need shop revenue, returns, product costs and marketing costs outside Meta.
How often should I report?
Check technical health, stock and spend daily. Make normal budget decisions in a regular weekly review. With few orders, add longer windows and state the uncertainty.
Which metric decides whether to increase budget?
No single metric. Target costs and data quality must fit, contribution must support the step, and stock and cash flow must allow it.
We review costs, purchases and creative together so your team can decide what stays live and what needs to change. See how we handle Meta ads at Mesper.
A testing plan needs new ads to go live. Review your creative approval process before planning the next testing week.