Calculate DTC MER: Formula, costs and ROAS
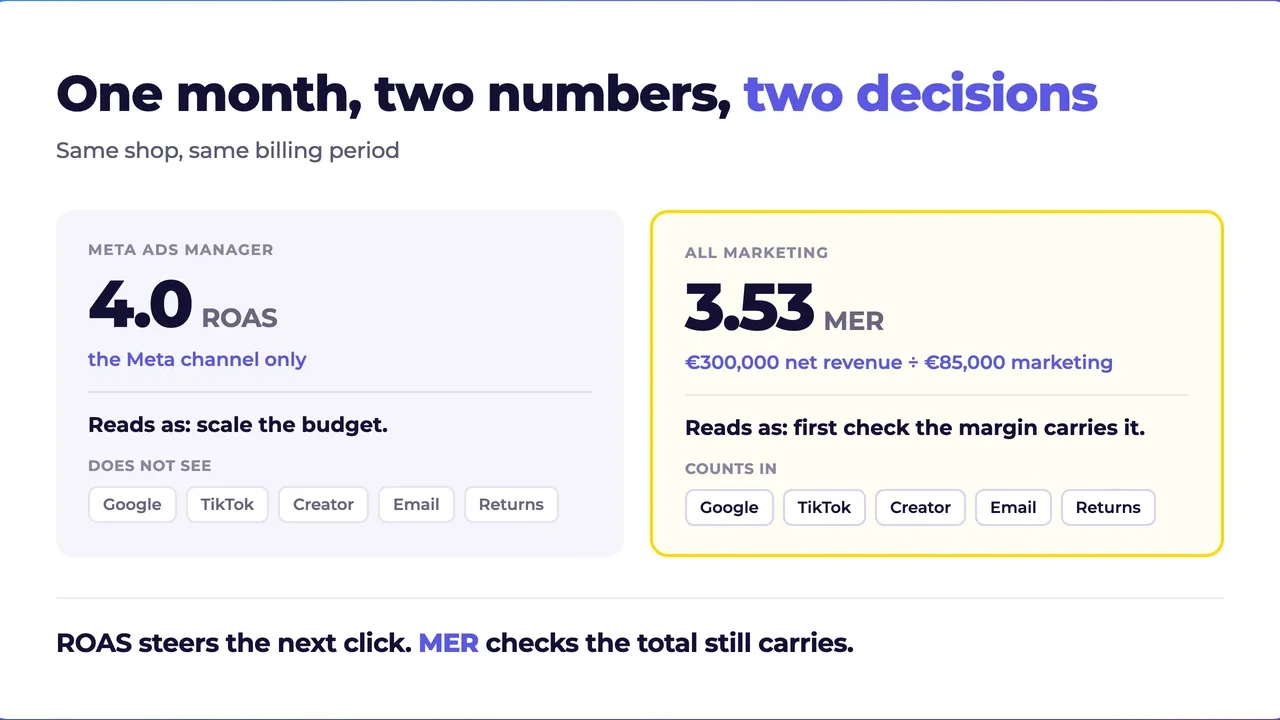

A Meta ROAS of 4 does not tell you whether the whole marketing operation pays off. You still need revenue across channels, the defined marketing costs and your margin.
Marketing efficiency ratio compares total revenue with your defined marketing costs. Read it alongside contribution margin to see whether the numbers work.
What is MER?
MER stands for marketing efficiency ratio. People use the term with different cost bases. In this article, marketing MER means total net revenue ÷ all defined marketing costs. Media MER, often called blended ROAS, means total net revenue ÷ media spend across every channel. Compare figures only when the revenue and cost bases match.
Say a shop does €300,000 net revenue in a month. €85,000 goes out on Meta, Google, TikTok, creators and other variable marketing costs. €300,000 divided by €85,000 gives an MER of 3.53. So the shop earns €3.53 in revenue per marketing euro. Whether that is good is not decided by a benchmark, but by margin, repeat rate, fixed costs and cash flow.
MER, ROAS and contribution margin do three different jobs
Most reporting problems come from trying to answer three different questions with one number.
- ROAS: which channel, campaign type or creative generates attributed revenue? That is the question for Ads Manager.
- MER: how efficiently is all our marketing working against total revenue? That is the question for running the business.
- Contribution margin: after goods, marketing and variable costs, is enough left? That is the question about profitability.
ROAS is good at moving budget between creatives, campaigns and channels. MER is good at raising the alarm when that optimisation only shifts revenue from one channel to another. Contribution margin decides, in the end, whether growth is worth anything at all.
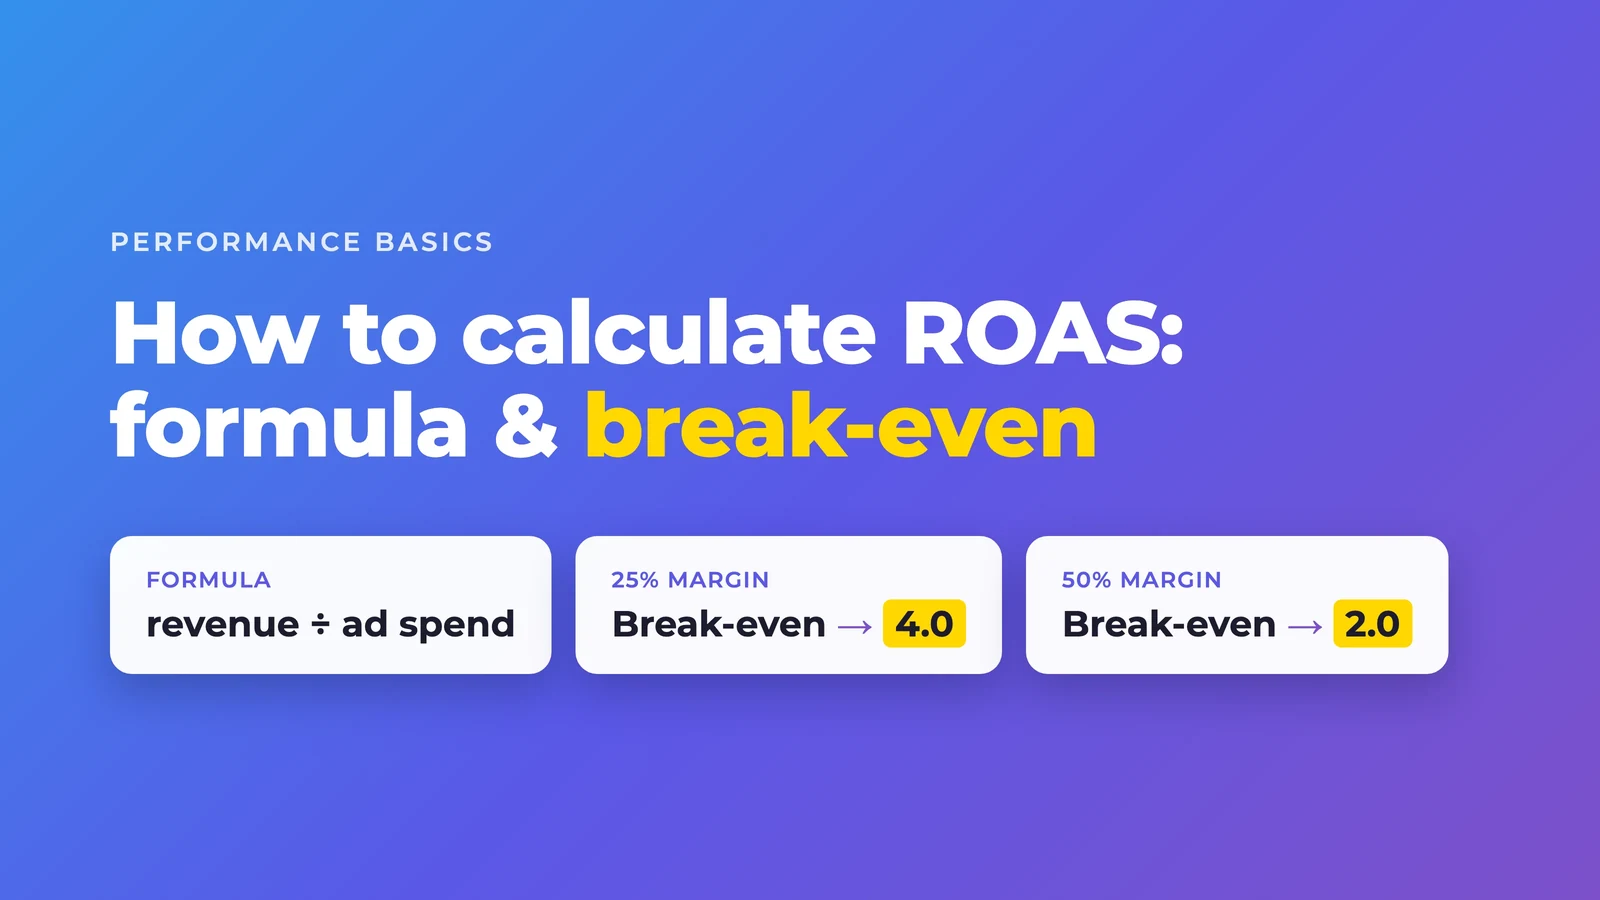
The ROAS guide explains the platform view. MER sits one level up.
Why a rising ROAS can leave you poorer
Picture turning Meta down. Your Meta ROAS rises because only the easiest remarketing orders are left. At the same time new customers drop, total revenue stalls, and Google or email catch less demand. In Ads Manager that looks tidy. In the business it is a step back.
Scaling does the opposite. A creative brings new demand, the Meta ROAS falls a little, but total revenue grows faster than marketing costs. MER and contribution margin then show whether the drop is acceptable.
The rule behind it: ROAS steers the next budget decision. MER checks whether the sum of those decisions still runs in the right direction.
How to calculate MER cleanly
The formula is not the hard part. The definitions are. Use different costs or a different revenue figure each month and you build a number that only looks precise.
1. Take the revenue that actually reaches the company
For D2C, net revenue after cancellations and returns is the cleanest base. Gross GMV sounds better, but a metric is not meant to please you. It is meant to tell you what is happening.
2. Capture every variable marketing cost
At a minimum that means media spend on Meta, Google, TikTok and other paid channels, creator commissions and affiliate payouts, variable creative and UGC output if you buy it monthly, and the agency fee when it directly relates to ongoing marketing.
Whether you include CRM, your own team salaries or tools is a legitimate management decision. The only thing that matters is that you define the scope once and do not change it every reporting weekend.
3. Work on the same time base
Daily MER fluctuates more than monthly MER. Use a seven-day trend for ongoing reviews and assess the closed month separately. Keep the revenue and cost bases consistent.
4. Never compare MER without contribution margin
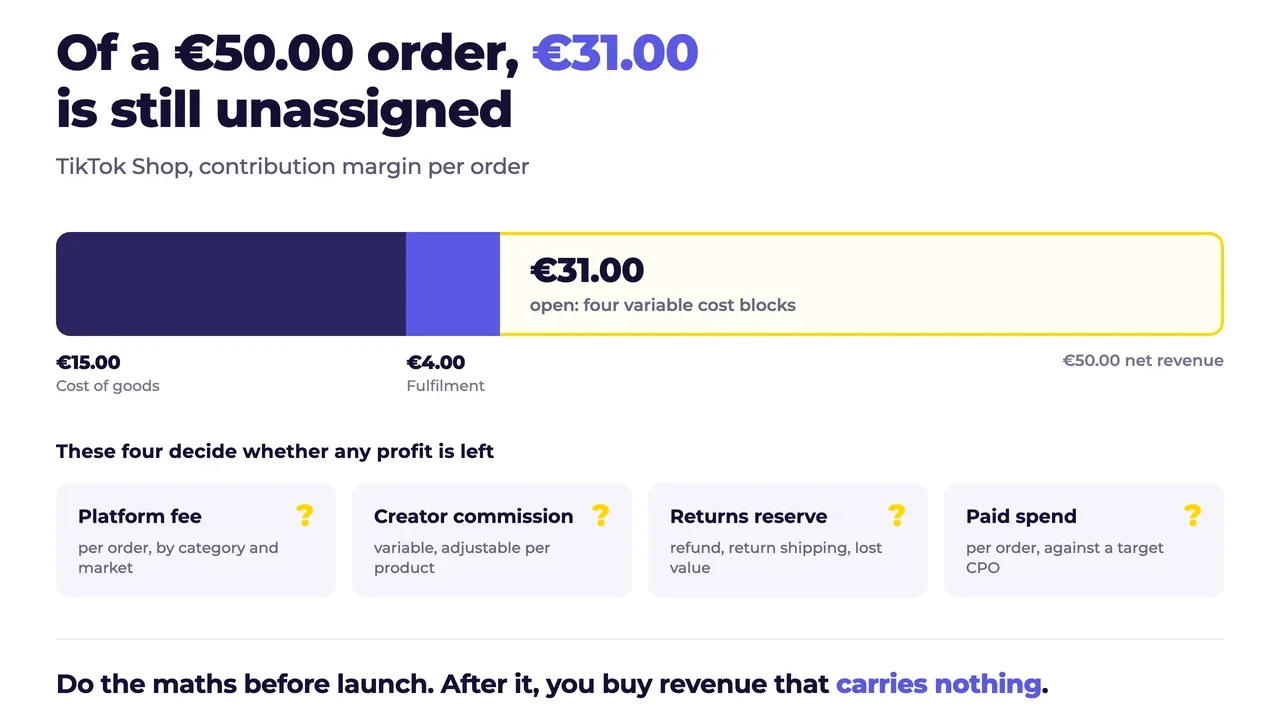
An MER of 4 means a different business at 70 per cent gross margin than at 35 per cent. So there always has to be at least one number next to it: what is left after cost of goods and marketing?
What is a good MER?
A good MER depends on your margin and cost basis. A blanket target is little help.
Work backwards from your own calculation: divide net revenue by the maximum marketing spend your business can afford. First define what must remain after goods, payment, fulfilment, returns and fixed costs. That determines the available marketing budget.
That is also the moment you notice whether a supposedly good ROAS is too low. A platform can report profit while the blended MER slips below your real limit.
A fictional month: calculate MER and profit together
This simplified example is not a client case. Every figure covers the same closed month, with costs excluding recoverable VAT. Net revenue after discounts, cancellations and refunds is €300,000.
- Cost of goods: €150,000.
- Payment and fulfillment: €30,000.
- Media spend: €70,000.
- Other marketing costs, such as creators and the agency: €15,000.
- Remaining fixed costs: €20,000. Marketing costs already counted above are not counted again.
Media MER = 300,000 ÷ 70,000 = 4.29. Marketing MER = 300,000 ÷ 85,000 = 3.53. Both describe the same month. Changing the denominator has not improved your efficiency.
Monthly profit before tax = 300,000 − 150,000 − 30,000 − 70,000 − 15,000 − 20,000 = €15,000. A marketing MER of 3.53 leaves 5% of net revenue as profit in this example.
For a €15,000 profit target, total marketing costs can be at most 300,000 − 150,000 − 30,000 − 20,000 − 15,000 = €85,000. The target marketing MER is therefore 3.53. This calculation holds under these assumptions. Scaling can change margins, refunds and costs.
These figures are our own calculation. Separating revenue, costs and profit follows the basic principle in Google's ROI explanation.
The four most common MER mistakes
1. Counting only paid spend and leaving creators out
Creators, affiliates and whitelisting are not free reach. Their defined costs belong in our marketing MER. If you deliberately measure media MER, include the other marketing costs separately in your profit calculation and name the metric clearly.
2. Taking revenue before returns
That is especially dangerous in fashion, beauty and impulse-driven offers. Your dashboard gets a nicer number. Your account does not.
3. Using MER as a channel KPI
A single Meta campaign has no meaningful MER. For that you use ROAS, CPO and creative signals. MER is the top-down view.
4. Rebuilding everything after one bad day
MER is a trend, not a panic button. First check whether a tracking problem, a wave of returns or delayed revenue is distorting the number.
How MER belongs in your weekly reporting
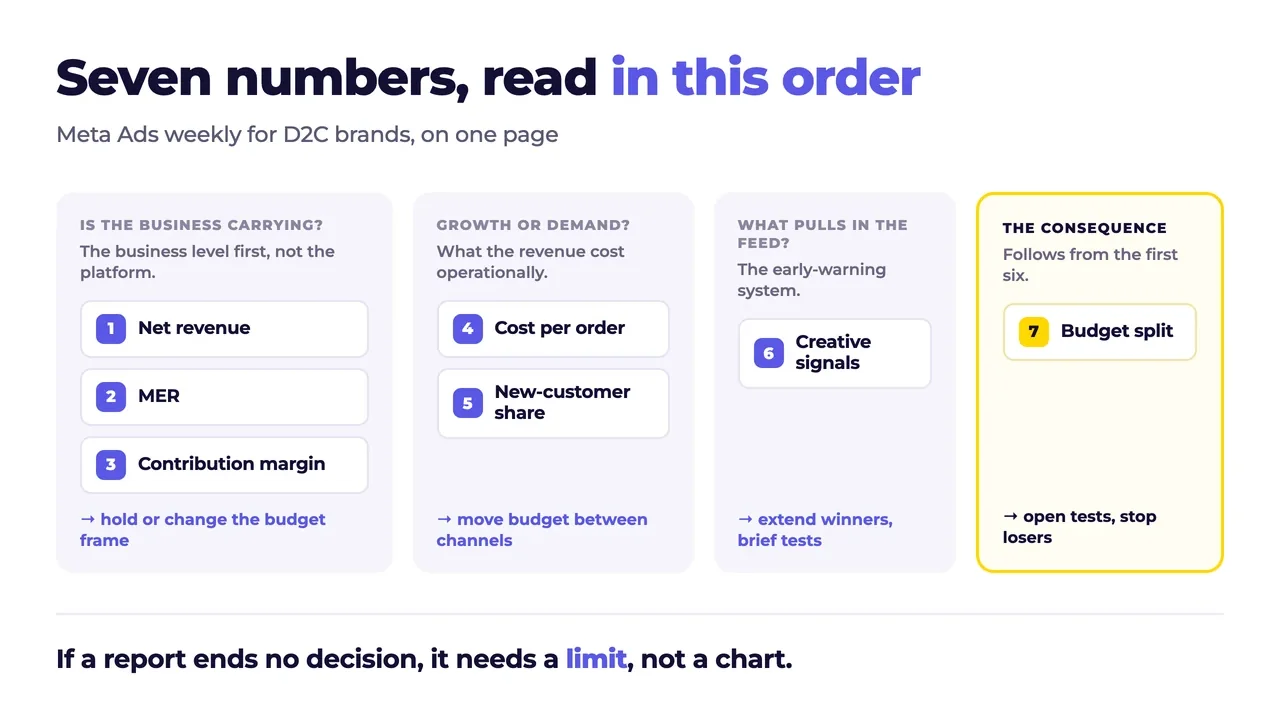
A usable weekly does not need 40 charts. It needs an order.
- Net revenue and 7-day MER: is the business still inside the guardrail?
- Contribution margin after marketing: is revenue growing in the right direction?
- Channel ROAS and CPO: where is budget being moved?
- New-customer share, AOV and returns: what explains the change?
- Creative signals: what do we test next?
That dissolves the false fight over "ROAS or MER". You need both numbers, just not for the same decision. Which seven metrics otherwise belong in the weekly is in the Meta Ads reporting guide.
Calculate the number that runs your company
If your report shows only platform figures, add the business view. Calculate MER for the last closed month using the defined marketing costs, then read it alongside contribution margin. That gives the next budget discussion a clear basis.
Use the profit planner to work through your own figures. Check which costs you include before comparing metrics. Through growth strategy, we review where the next budget step makes sense.
Frequently asked questions about MER
What is the difference between MER and ROAS?
ROAS measures attributed revenue against the spend of one channel or campaign. MER sets total revenue against all defined marketing spend.
Should I include creator costs in MER?
Yes, if creators are part of your ongoing demand generation. What matters is a clear definition you keep over time.
Can a good MER be unprofitable?
Yes. MER knows neither cost of goods nor fulfilment, returns or fixed costs. It is an efficiency metric, not a profit and loss statement.
The profit calculator uses the cost fields shown in its interface. Check that denominator before comparing its MER with the marketing MER defined here.