Creative testing framework: budget, measurement and decisions
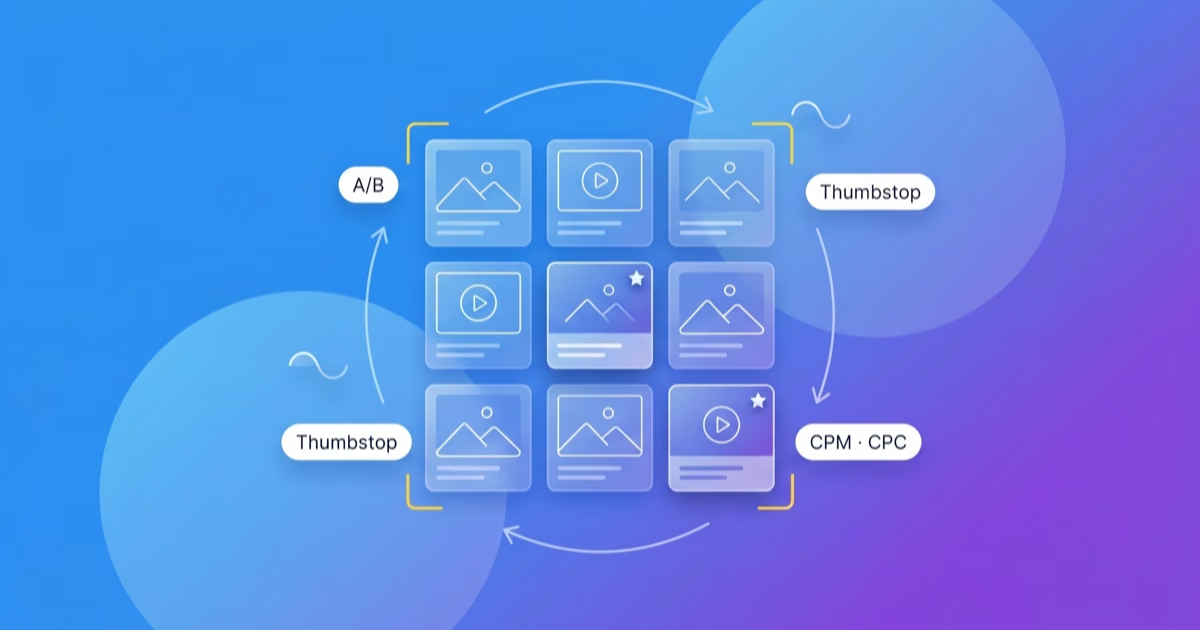

Your creative test needs a budget and a decision before launch. Otherwise you produce new ads, collect numbers and still cannot say what should keep running.
This framework connects the reason to buy, test budget, measurement and weekly review. Every figure in the example is hypothetical. These are worked calculations, not Mesper client results or universal benchmarks.
What is creative testing?
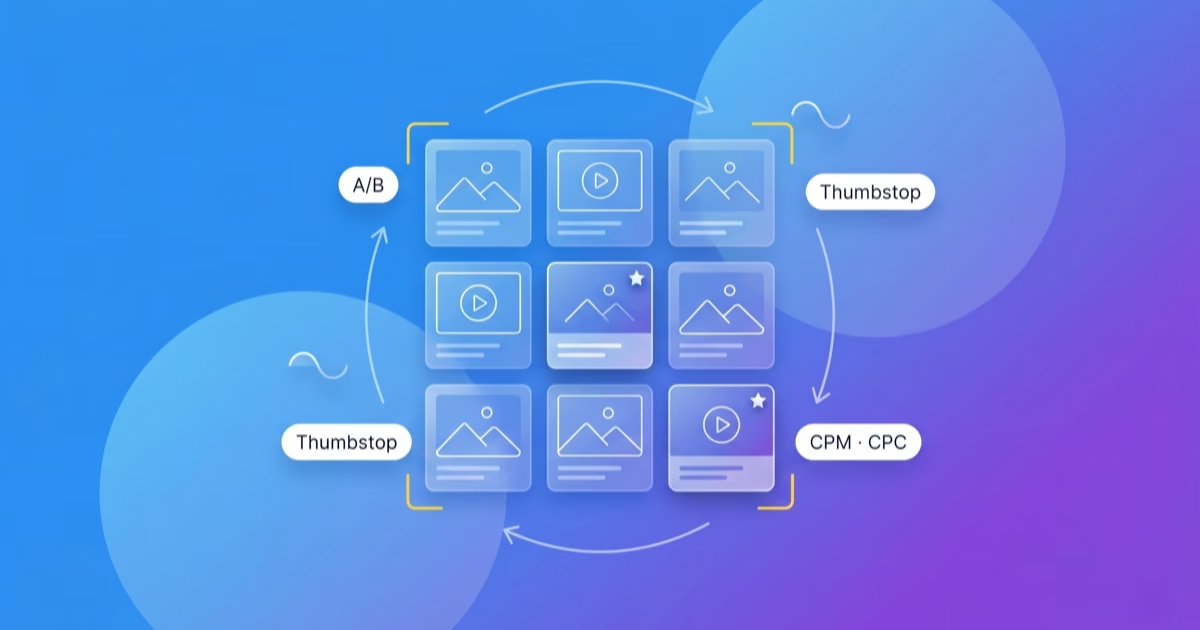
Creative testing is a planned comparison of ad content to answer a specific question: which reason to buy, hook or piece of evidence delivers orders at affordable costs under the tested conditions? An ongoing creative comparison supports operating decisions. A controlled experiment answers a narrower comparison question. Both need a documented starting point.
- Angle: the reason to buy. For example, less effort in an everyday routine.
- Concept: the execution of that reason. For example, a product demonstration in a typical everyday situation.
- Variant: a change to that concept. For example, a different opening with the same demonstration.
- Control: an existing ad with documented costs and orders in a comparable period.
Three edits of the same demonstration are three variants. Do not count them as three new reasons to buy. Plan new angles and improvements to existing concepts separately. The test has to establish whether a new concept performs better.
1: Derive target costs from your margin
Define what you are paying for. CPO = ad spend divided by attributed orders. CPA is the broader term for cost per defined conversion. When that conversion is an order, the calculations can be identical. New-customer CAC counts new customers and requires a separate data basis.
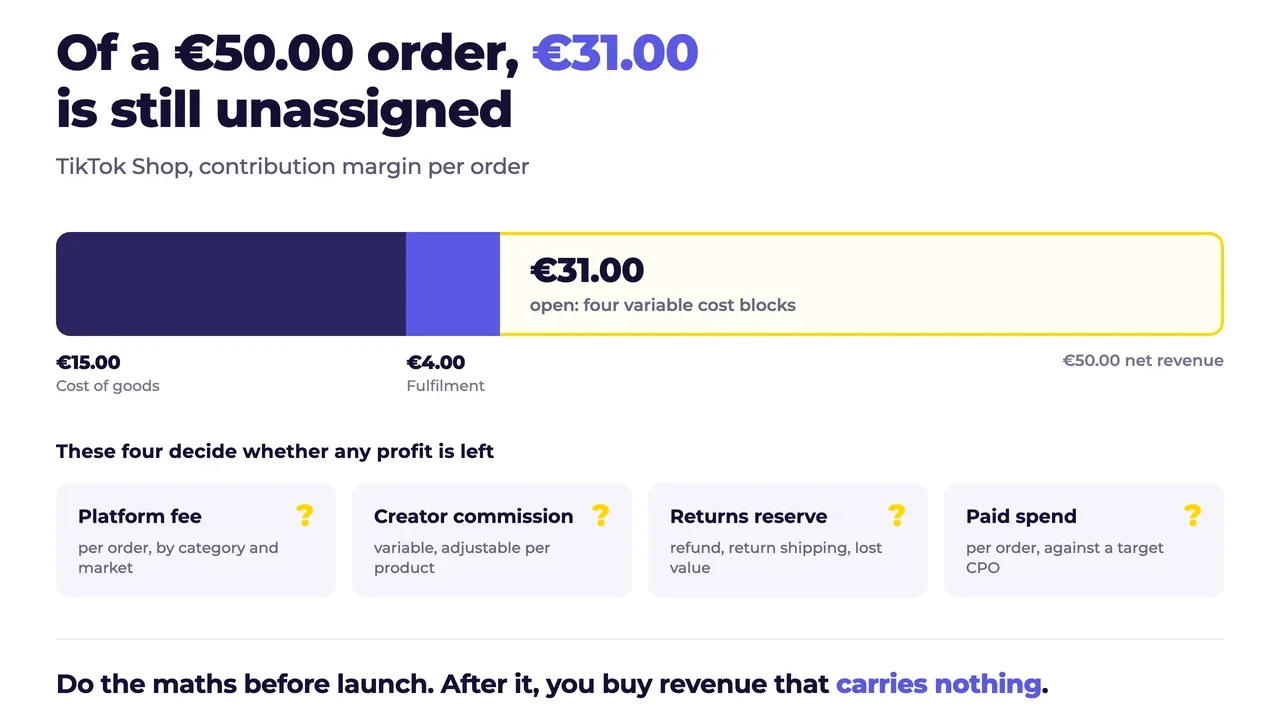
Hypothetical calculation: An order brings €80 in net revenue after VAT, discounts and expected returns. Product costs are €24, with another €8 for shipping, fulfilment and payment. That leaves €48 before marketing. The brand reserves €8 per order for other marketing costs and wants to retain €10 in contribution after marketing. Available media cost is €48 minus €8 minus €10 = €30 target CPO.
The €30 applies only to this example. Use your own product margins, returns and costs. A brand planning to lose money on the first purchase also needs reliable repeat-purchase and payback data. Assuming future revenue does not make a test profitable.
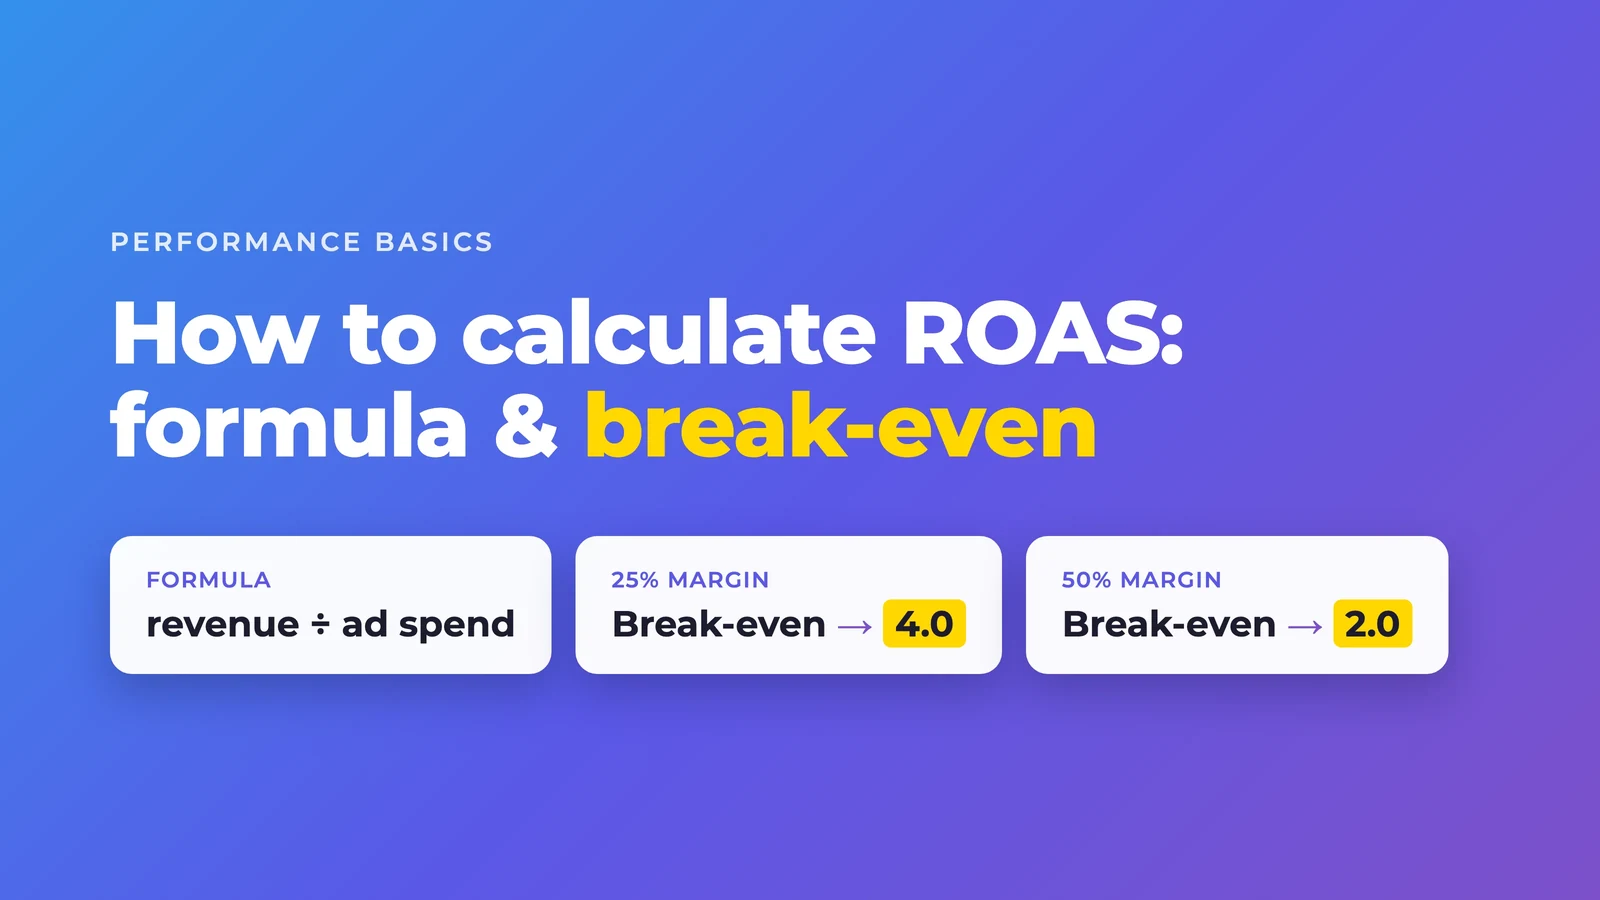
Attributed orders in an ad report are not automatically additional orders. A margin-based target CPO is an operating limit. It does not replace a check of shop revenue and contribution. The ROAS guide explains the calculation basis.
2: Set test volume from the available budget
Start with the budget you can actually risk on new tests. Divide it by planned spend per test. That gives you the number you can finance. It does not establish a statistically sufficient sample.
Hypothetical weekly plan: The brand has €3,000 in Meta media budget. It allocates €2,400 to existing ads and €600 to new tests. Two concepts can spend up to €300 each. At a target CPO of €30, that would mean ten orders per concept if performance were exactly on target. Ten orders are a small sample. The plan finances an initial decision, not reliable proof of a winner.
€600 divided by €300 in planned spend finances two tests. Ten simultaneous tests would have just €60 each. At the same target CPO, that means two orders each in the calculation. If you need to compare purchases, running fewer tests at once is the better decision here.
The €300 is a planned cap per concept in this example. Check actual delivery: a budget plan does not guarantee a particular spend per ad. A concept that receives little spend is insufficiently tested. It is not a proven loser. Approve extra spend only against a documented remaining budget.
3: Write a test card before production
- Question: Does a concrete product demonstration lower CPO compared with the existing ad's general product promise?
- Hypothesis: The demonstration answers an unresolved usage question and could help more suitable visitors buy.
- Change: Change the reason to buy and supporting evidence. Keep product, price, destination, conversion goal and planned delivery context comparable.
- Measurement: Review spend and attributed orders using the same attribution. Calculate CPO. Use video and click signals separately for diagnosis.
- Limits: In this hypothetical plan, no more than €300 per concept. Review after seven complete days and check the data again after the known purchase delay. Act immediately on a broken shop, missing stock or an incorrect ad.
- Decision: Keep, stop, produce a named variant or continue testing with a limited additional budget. Set the owner and next review date before launch.
Changing hook, price, audience and landing page at once tests a package. You cannot establish which individual change caused the difference. A precise comparison question needs a controlled design with appropriate sample planning.
4: Define every metric and its denominator
Hook rate and hold rate are ambiguous terms. Record the formula in the report. Meta lists video, click and reach metrics as separate fields in its official SDK reference. Agreeing on a name alone does not make calculations comparable.
- Hook rate in this framework: three-second video views divided by impressions, multiplied by 100. Use it only for suitable videos.
- Hold rate in this framework: views reaching 50% of the video divided by three-second video views, multiplied by 100. Read it only across comparable video lengths. This ratio is unsuitable for very short videos.
- Link CTR: link clicks divided by impressions, multiplied by 100. Do not mix it with all clicks.
- Link CPC: spend divided by link clicks. State the click type.
- CPM: spend divided by impressions, multiplied by 1,000.
- CPO: spend divided by defined attributed orders. With zero orders, no finite CPO can be calculated. Show spend and zero orders.
Leave a rate blank when its denominator is zero. Static ads do not get a video hook rate. A low CPM does not prove a strong message. A cheap click does not prove purchase intent. Auction conditions, audience, placement and offer can all affect the numbers.
A good hook rate with a weak CPO calls for investigation. The opening may create the wrong expectations. The problem may sit after the click. Check the destination, stock, loading behaviour and purchase journey before blaming the story.
5: Make the weekly decision with uncertainty visible
Completed hypothetical review: Both concepts and the control ran during the same seven-day period. The brand accounted for the known purchase delay and exported the data again. Attribution and conversion definitions match. This ongoing comparison still does not establish causality.
- Control: €900 spend, 30 attributed orders, €30 CPO. Keep running. It meets the target in this example.
- Concept A, product demonstration: €300 spend, 12 orders, €25 CPO. Keep and continue with a limited budget. Twelve orders do not justify a confident winner claim. With no additional weekly budget, give A more room within the existing allocation if overall margin supports it.
- Concept B, general promise: €300 spend, five orders, €60 CPO. Stop this version. It used the agreed test budget at twice the target CPO. This is a risk decision for this brand, not proof that the angle cannot work.
Iteration for B: Click data shows interest, but orders are weak. Hypothesis: the promise before the click is more specific than the product page. The team checks that page first. If it confirms the mismatch, it produces a version with a clear demonstration and the same price. It does not change five things at once.
Next budget step: The brand approves €330 for A in the next period instead of €300. That is a 10% increase and a deliberately limited hypothetical decision. Before the next step, it checks CPO, order volume, new-customer mix, stock and contribution again. A small budget step does not guarantee stable performance.
If an ad has spent €40 with zero orders, its status in this plan is open. If it reaches the cap with zero orders, stop it after checking tracking and purchase delay. Your brand sets how much risk it accepts beforehand. No universal spend multiplier protects every good ad.
6: Keep production and review in a regular cadence
Check spend, technical defects, stock and unusual delivery daily. Group normal CPO and budget decisions into the weekly review. Compare seven, 14 and 30 days to separate short fluctuations from a longer decline. Mark recent days with pending purchases as provisional.
Rising frequency and falling click or video rates can suggest fatigue. They do not prove it. Check audience mix, budget, season and offer too. Brief the next angle from an unresolved purchase barrier, not an isolated red metric.
Frequently asked questions about creative testing
How many creatives should I test each week?
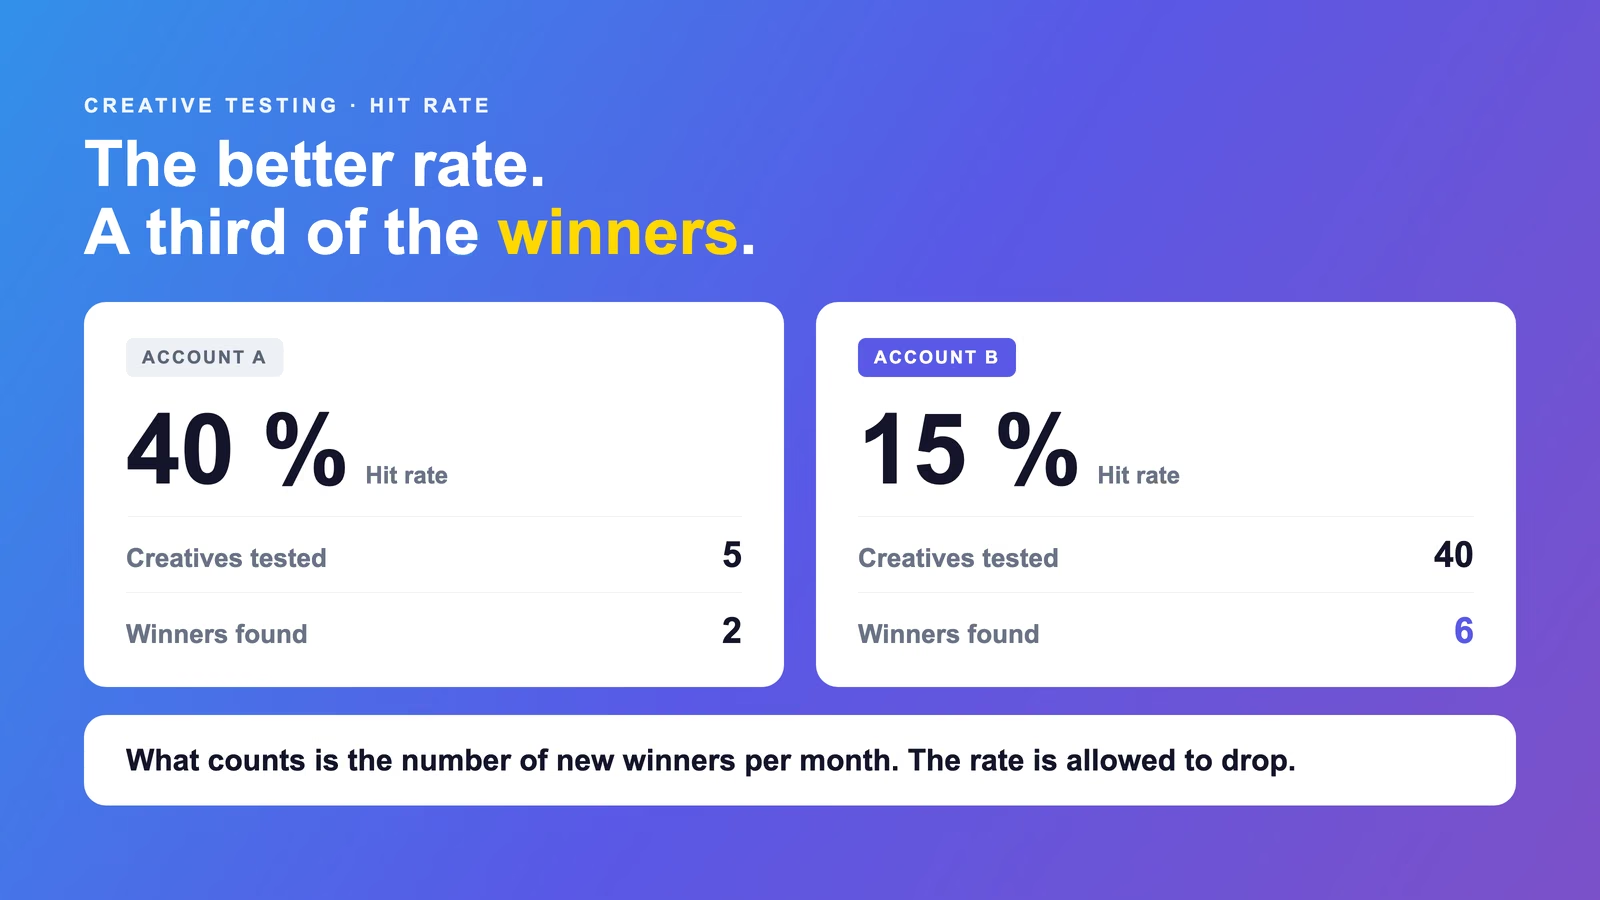
As many as the test budget can meaningfully evaluate. In the hypothetical example, €600 finances two tests capped at €300 each. That number follows from target costs, risk and data needs. It is not a recommendation for every account.
How long should a creative test run?
Set the review period, budget cap and purchase delay before launch. A weekly review is a working cadence, not a guarantee of sufficient data. With few orders, extend a specific test using approved budget or record the result as open.
When can I scale?
When target costs, data quality and business margin support the next budget step. A strong ratio with few orders remains uncertain. Review again after every step.
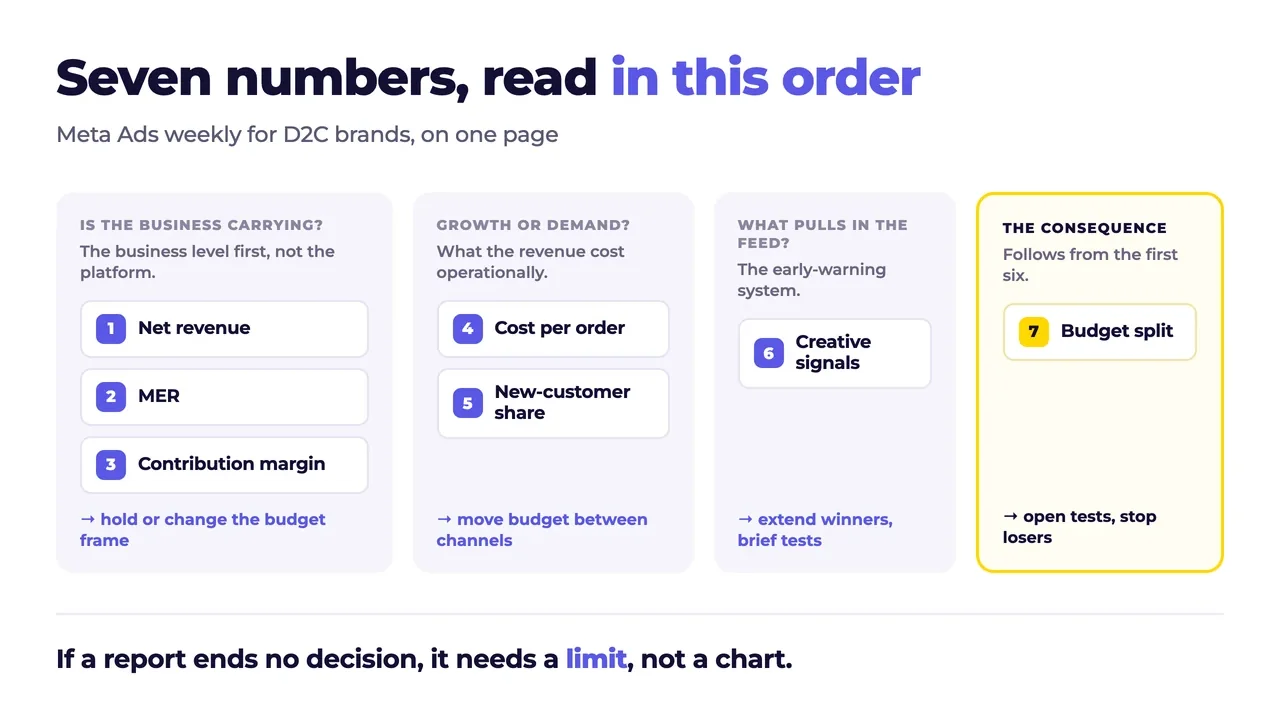
Use the Meta reporting guide with a completed weekly example for the review structure. For concept, production and delivery, creative design and Meta ads at Mesper work in the same process.
Book an introductory call with Mesper.
A testing plan needs new ads to go live. Review your creative approval process before planning the next testing week.











Klären wir deinen nächsten Schritt zusammen
Let’s work out your next step together