Calculate ROAS: Formula, break-even and three mistakes

Your ad account shows a ROAS of 4.2. Your P&L for the same month shows a loss. Those results can coexist: platform ROAS and your profit calculation use different cost and revenue bases. Check both before raising the budget.
Work through ROAS and break-even, compare gross and net revenue, and check three common dashboard mistakes.
What is ROAS?
ROAS (return on ad spend) is the ratio of revenue generated by ads to money spent on ads. €12,000 in revenue from €3,000 in ad spend is a ROAS of 4.0.
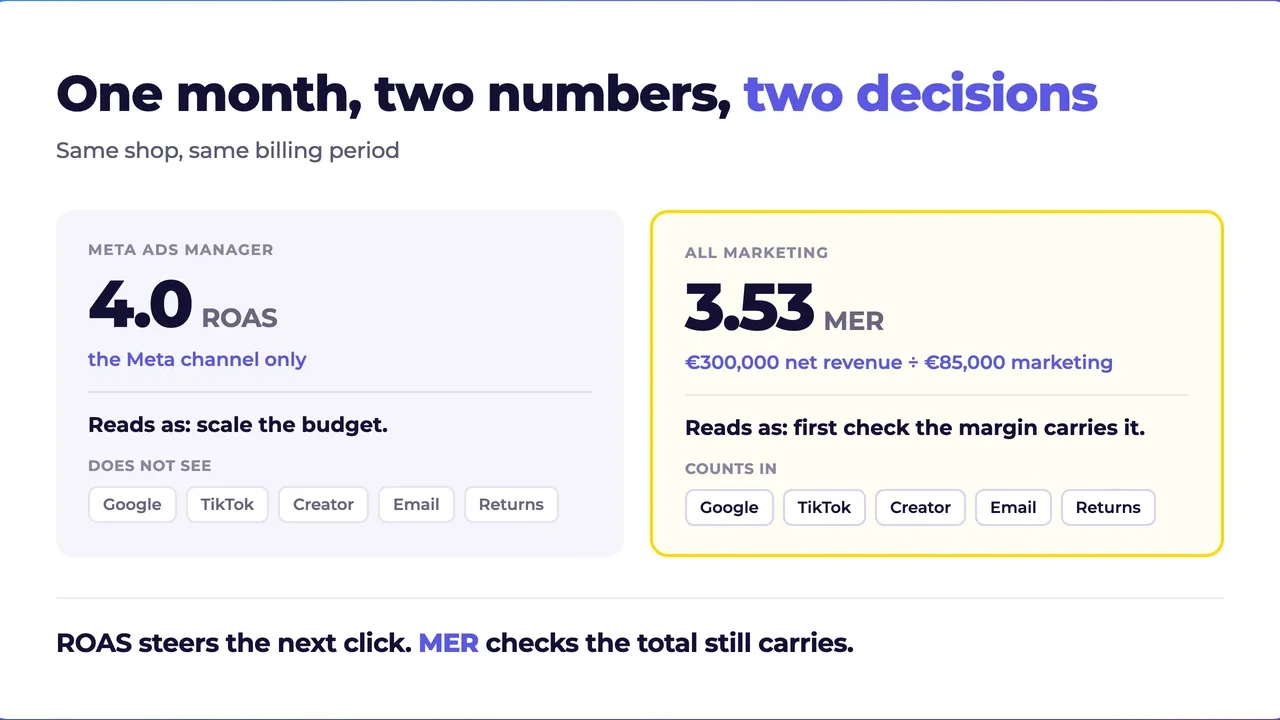
Meta and Google show platform ROAS in your dashboard: revenue each platform credits to itself, based on its own attribution model. A blended view instead uses your actual total revenue from Shopify or your ERP, summed across every channel. The two numbers often diverge sharply, more on that in the channel silo section below.
The formula and an honest example
ROAS = attributed revenue ÷ ad spend. Check the revenue basis. Platforms report values supplied by your tracking and settings. Those values can be gross, net or otherwise defined. Check discounts, tax, shipping, currency and refunds. Google explains how conversion values are configured.
Fictional example assuming 19% VAT: €12,000 gross is €10,084.03 net. At €3,000 ad spend, gross ROAS is 4.00 and net ROAS is 3.36. The gross value is 1.19 times the net value. Targets and reported results need the same revenue basis.
ROAS, ROI, MER: three numbers, three jobs
All three run on the same underlying numbers and still answer different questions.
- ROAS: revenue ÷ ad spend. Runs your campaigns, checked daily.
- ROI: profit ÷ defined investment. In a separate fictional net example, €12,000 net revenue, €3,000 ads and €6,500 other attributable costs leave €2,500 profit. Using the €9,500 cost base gives a 26.3% ROI and a net ROAS of 4.0. The investment being assessed determines which costs belong in ROI. Google's ROI explanation likewise separates revenue, profit and costs.
- MER: In our guides, marketing MER means total net revenue ÷ all defined marketing costs. Media MER, often called blended ROAS, divides total net revenue only by media spend. Both belong in the monthly review with their denominator clearly named. The MER guide calculates both using the same month.
Break-even ROAS: when an order covers its media cost
Break-even ROAS is the ROAS at which an order covers its own ad cost. You calculate it from contribution margin.
Fictional example assuming 19% VAT: a product sells for €79.90 gross, rounded to €67.14 net. Cost of goods is €22.00, shipping €4.50, payment €1.60 and fulfillment €3.00. Contribution before advertising is €36.04 per order. Other marketing costs, fixed costs and target profit are not included yet.
At this media break-even, ad spend per order can be at most €36.04. Gross ROAS: 79.90 ÷ 36.04 = 2.22. Net ROAS: 67.14 ÷ 36.04 = 1.86. The threshold for your dashboard depends on the revenue it records. This covers media cost, not the entire company's profit requirement.
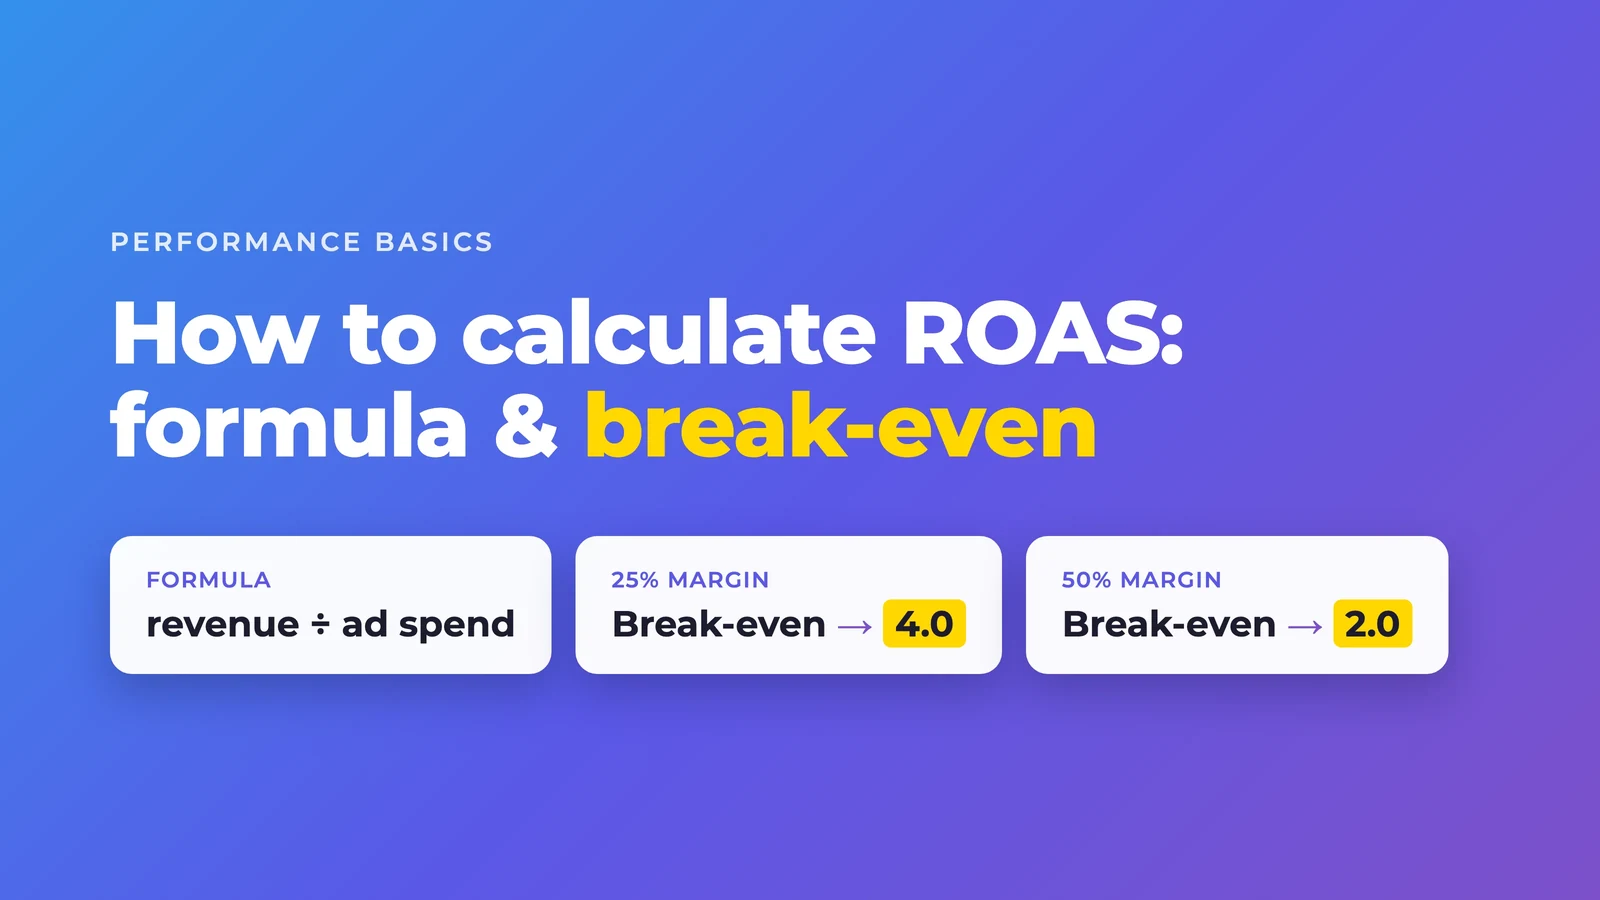
The reference below applies to net ROAS when margin means contribution before advertising as a share of net revenue. Net break-even ROAS = 1 ÷ margin. A 25% margin gives a net threshold of 4.0, or 4.76 gross under the assumed 19% VAT basis. A margin graphic also needs this explicit basis.
- Contribution before advertising at 20% of net revenue: break-even 5.0
- 25%: break-even 4.0
- 30%: break-even 3.3
- 40%: break-even 2.5
- 50%: break-even 2.0
Below this threshold, the first order does not cover its media cost. Documented repeat purchases can change the customer-level calculation. Include refunds and their costs in expected contribution. Other marketing costs, fixed costs and target profit also need to be covered for company profitability.
Three ways your ROAS lies
- Attribution: the platform credits itself for view-through conversions and returning customers. A customer who would have bought anyway makes your ROAS look better, not your business. Look at new-customer ROAS separately. More on this: 5 reasons your tracking misleads you.
- Gross versus net: see the worked example above, plus your return rate. Dashboard ROAS reflects these only when supplied values and any adjustments account for them.
- Channel silo: your Meta ROAS climbs while total revenue stays flat. Overlapping attribution, a different channel mix or fewer new customers can contribute to this. MER shows the overall trend without proving any single cause.
What counts as a good ROAS?
A good ROAS sits above your break-even ROAS. There's no universal benchmark, because break-even depends on your margin.
At 50% contribution before advertising as a share of net revenue, net ROAS 2.0 covers media cost. At 25%, the net threshold is 4.0. These are not company profit thresholds. Check monthly profit alongside ROAS, using consistent cost definitions. More on costs: Lower CAC without losing reach.
Run the numbers for your store
Want to work through the calculation with your own figures? Get the profit planner.
If you'd rather walk through it together: 15 minutes, no obligation. Let’s talk.
FAQ on ROAS
How do you calculate ROAS?
ROAS = revenue ÷ ad spend. Example: €12,000 in revenue from €3,000 in ad spend gives you a ROAS of 4.0.
What's the difference between ROAS and ROI?
ROAS sets revenue against ad spend, no other costs included. ROI sets profit against your total investment, including cost of goods, shipping, and fixed costs. A ROAS of 4.0 can correspond to an ROI of 26%, depending on your cost structure.
What counts as a good ROAS in ecommerce?
A good ROAS covers the costs included in your target and leaves the profit you need. Media break-even alone excludes other marketing and fixed costs. Revenue basis, margin and target profit determine the threshold.
How high does ROAS need to be to turn a profit?
For media break-even, divide the revenue basis used in ROAS by contribution before advertising. The fictional example gives 2.22 gross or 1.86 net. Company profitability also requires other marketing costs, fixed costs and the desired profit to be covered.
Run it with your own numbers
Use the profit planner to work through your own figures. Check which costs are included and what should remain after advertising.
Once that number stands and budget allocation is the real question, growth strategy is the place to start.