Lower your CAC without losing reach: 7 levers
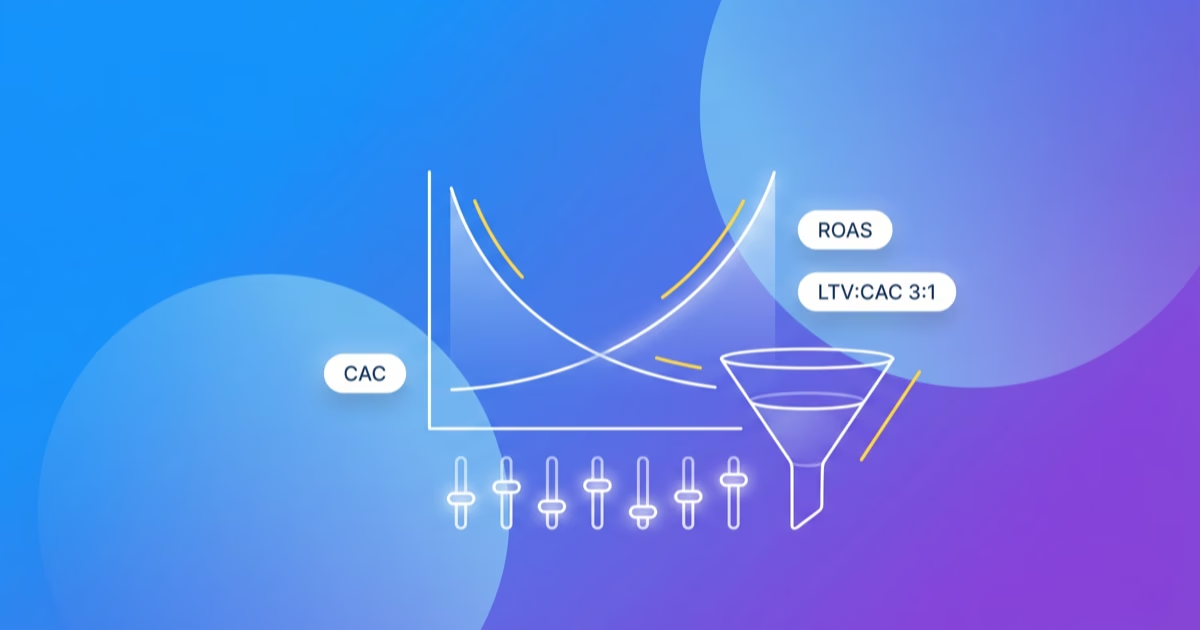

When CAC rises, start with the calculation: which costs are included, and how many real new customers are in the denominator? Then review tracking, creative, the offer, funnel and budget allocation. The goal is an affordable cost per new customer. Whether reach holds up is something to measure.
What is customer acquisition cost (CAC)?
Customer acquisition cost is the average amount you spend to win one new customer. The formula is: CAC = marketing spend ÷ number of new customers in the same period. Example: €10,000 in spend and 100 new customers give you a CAC of €100.
CPA measures the cost per conversion, such as a lead or purchase. CAC counts actual new customers. Even in e-commerce, the figures match only when the cost base, period and counted customers match. Repeat buyers in purchase CPA do not belong in the new-customer denominator.
The key points in brief
- CAC = spend ÷ new customers. Review the costs and customer count together. Lower spend alone tells you nothing about that ratio.
- Order of the levers: clean tracking first, then creative, offer and funnel, then budget allocation and LTV.
- Track reach separately. A budget or funnel change does not guarantee that reach will stay the same.
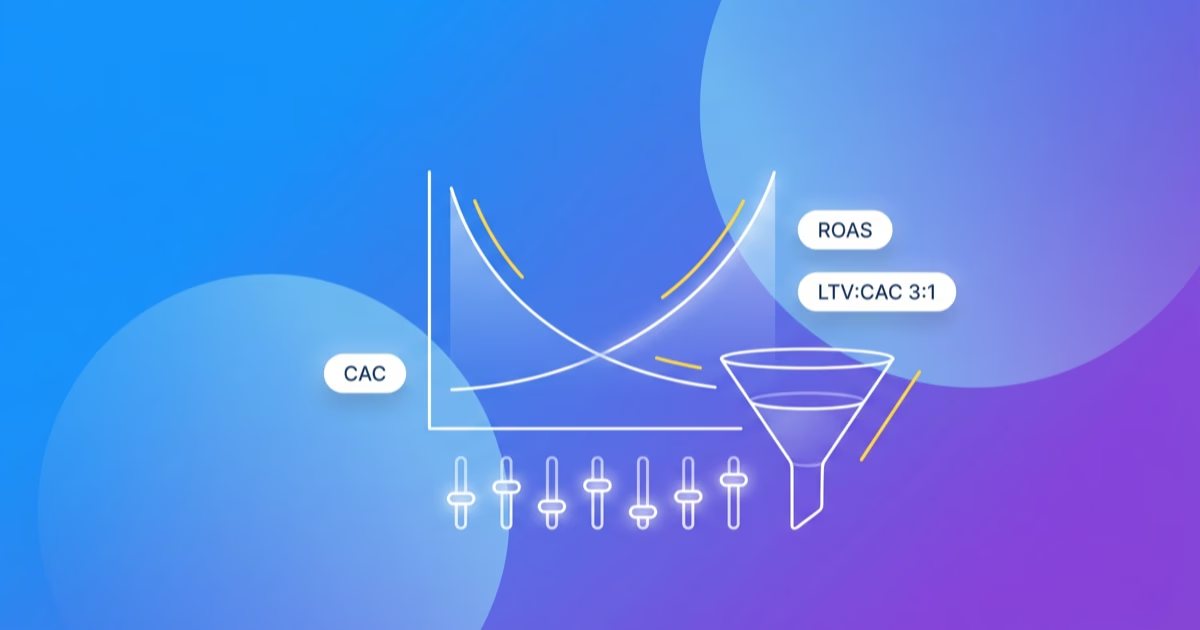
- Put the rule of thumb in context: an LTV:CAC ratio of around 3:1 is not a universal profit threshold. Include margin, repeat purchases and the time until you receive payment.
Why more reach rarely lowers CAC
A €100 CAC does not tell you what the next customer will cost. Before increasing spend, check whether the extra budget wins more customers at affordable costs. The result can vary with the offer, demand and delivery.
The 7 levers to lower CAC
1. Lay the tracking foundation first
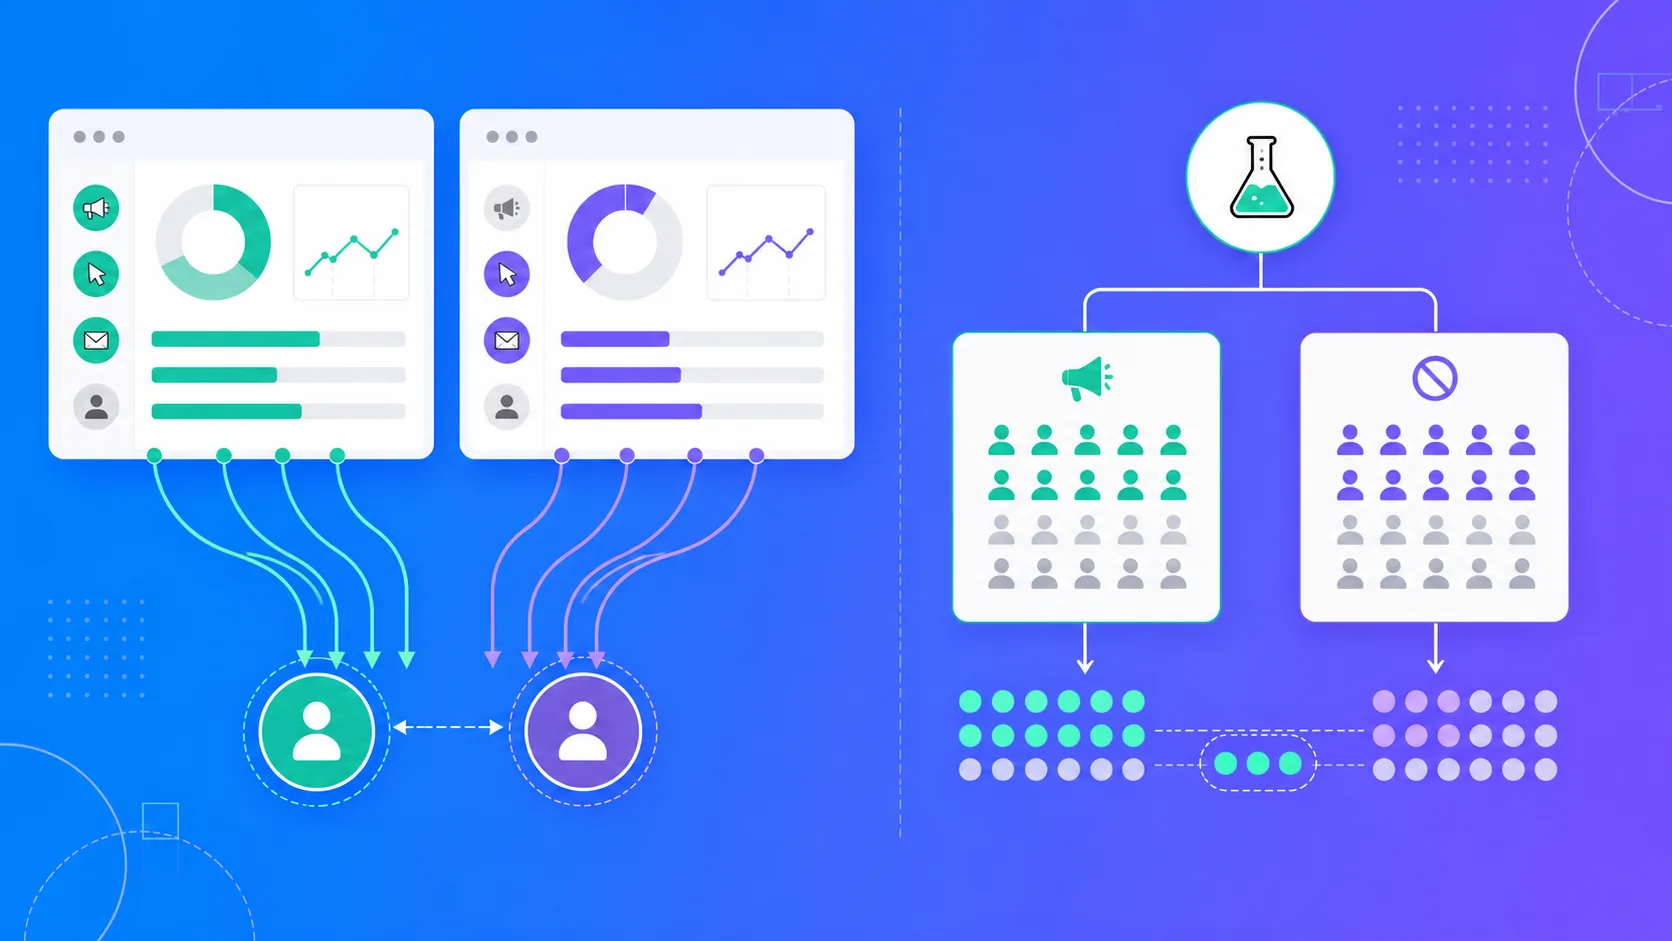
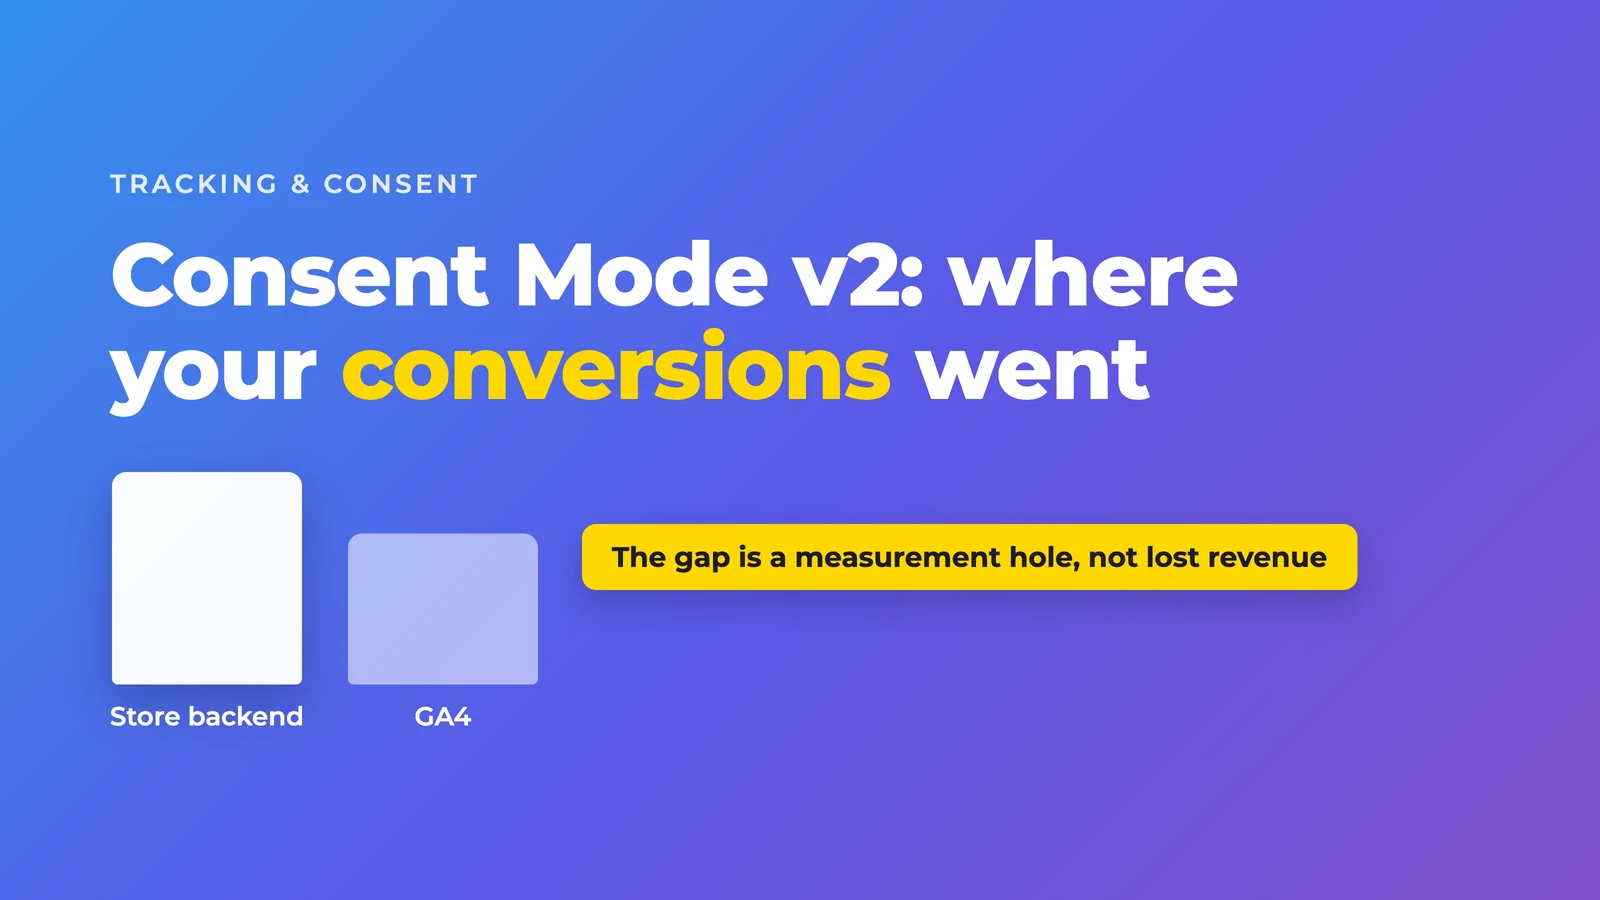
Clean conversion signals are an important starting point. Meta Conversions API supplements pixel transmission with server events. It does not replace required consent or guarantee complete data. If collection starts in the browser, ad blockers can still prevent it. The CAPI guide explains the signal flow and links to the official implementation rules.
In practice, use matching event_name and event_id for deduplication, correct values and timestamps, and matching data you are permitted to send. Event Match Quality describes user matching, not completeness or legal compliance. Check event coverage and reconcile with the backend separately. A technical fix does not guarantee lower CAC.
2. More winning creatives, not more budget
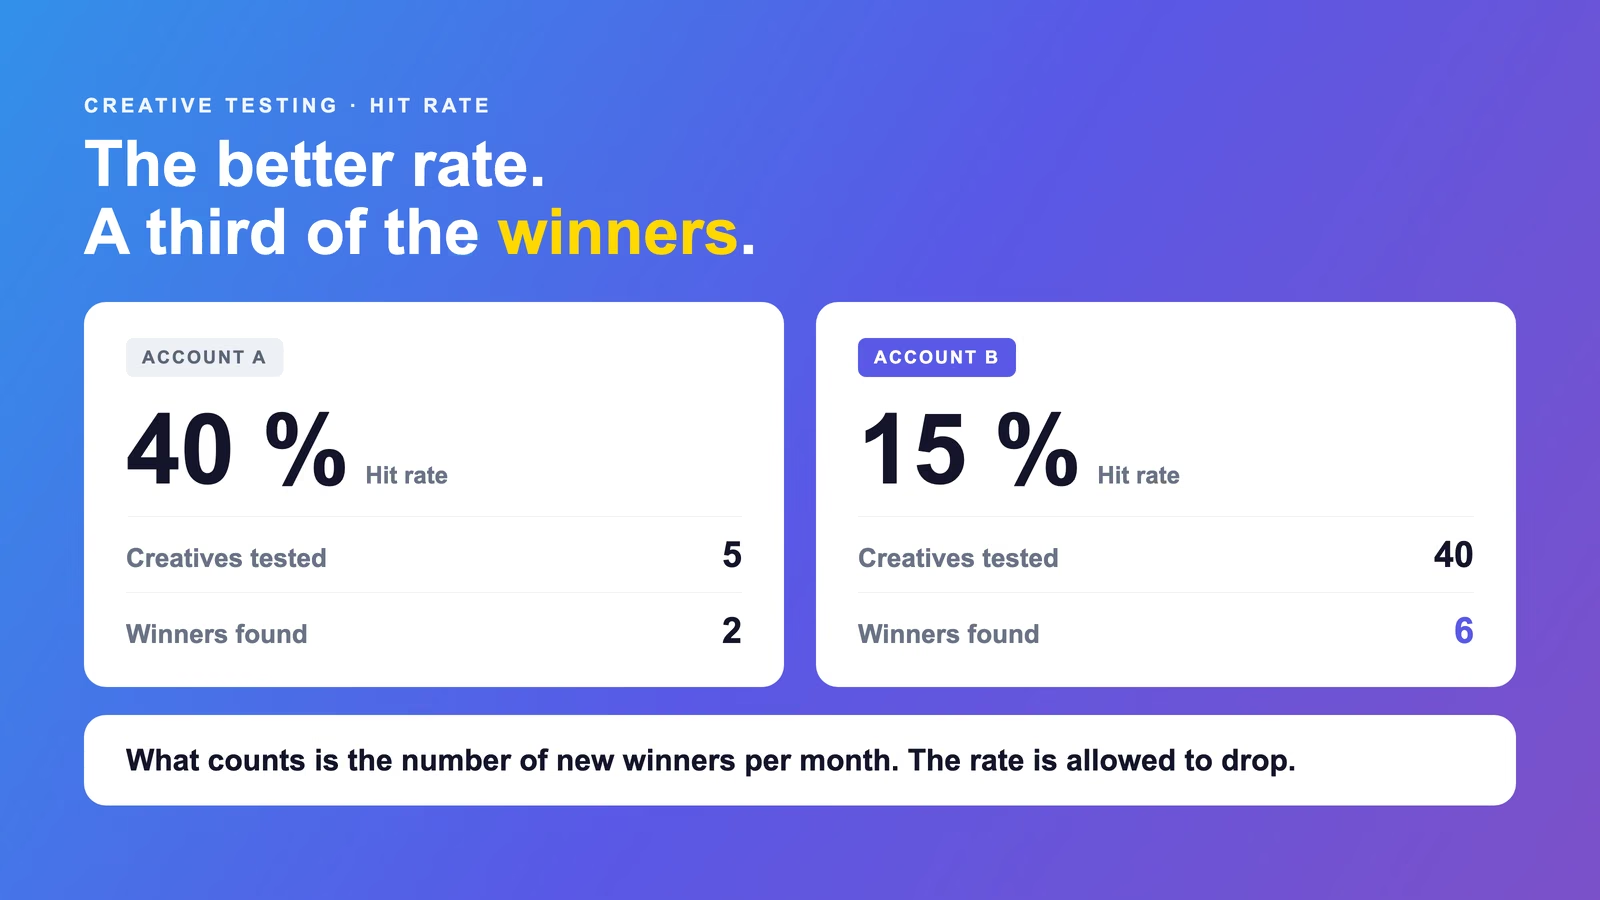
Test new reasons to buy and production styles against a suitable control. Click and video rates help diagnose the result. Check whether the creative improves new-customer costs using the economic outcome.
Plan a testing cadence that production and budget can support. New concepts need a clear question, useful variations and time for evaluation. More material alone does not keep performance stable.
3. Sharpen the offer
Check whether the offer is clear: which problem does it solve, why does the price make sense, and why buy now? Change a specific weakness and compare the result on the same basis.
With the same costs, traffic and new-customer share, doubling conversion rate halves CAC. That is a mathematical relationship. Whether an offer change achieves that doubling is a test question.
4. Declutter the funnel
Review the path from click to purchase: load time, landing-page clarity and necessary form fields. Record where people leave before rebuilding the whole journey.
Heatmaps and session replays help you observe behaviour on the page. They do not establish the cause alone. Form a specific hypothesis and assess the change with conversion data.
5. Optimise for signal quality, not audience size
Check events, values and permitted CRM data before changing the audience. More reported conversions do not establish lower CAC. Reconcile the data with actual new customers.
Broad and narrow audiences are testing choices. Compare them using clean data and the same economic target, rather than declaring one structure a universal winner.
6. Move budget to where it pays off
Compare campaigns using the same cost basis and their contribution to new-customer acquisition. A cheap platform conversion is not enough reason to move budget. Check whether account CAC actually improves after the change.
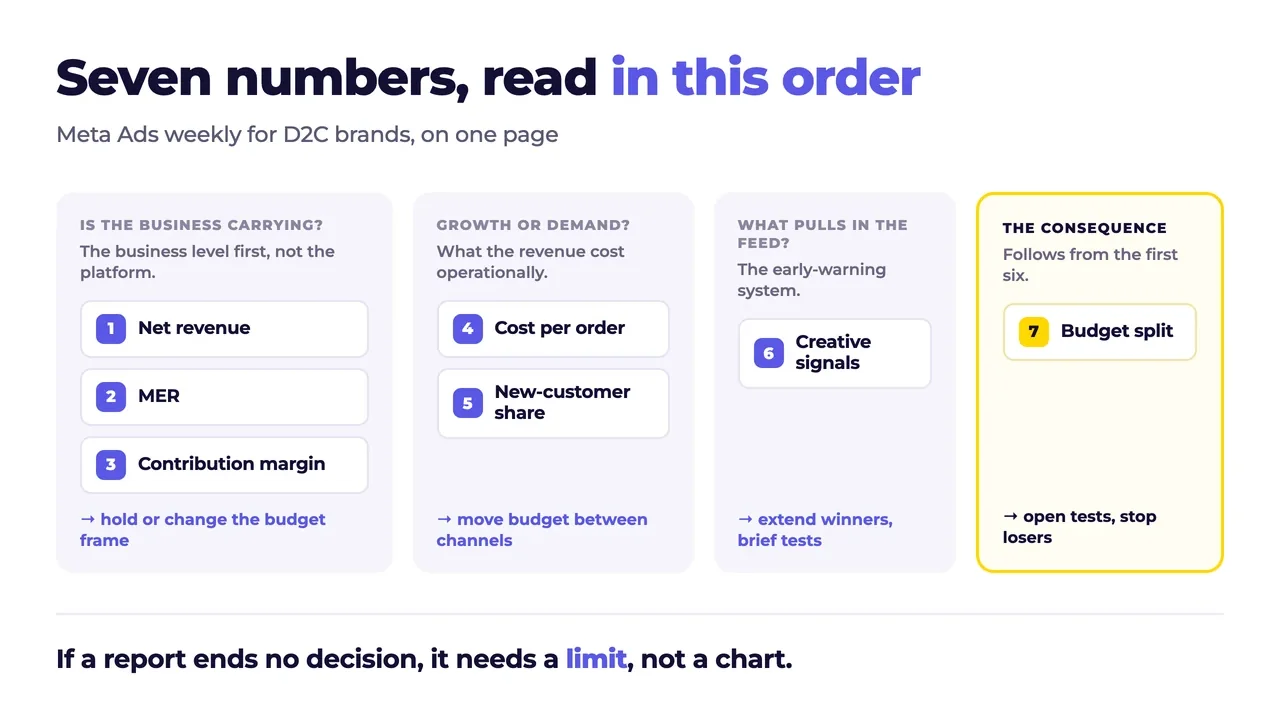
If a campaign is above target, review the data, period and role. Decide whether to pause it, rebuild it or keep observing. Record each budget move in the weekly report.
7. Use LTV to put CAC in context
A higher CAC can be affordable if the customer later generates enough contribution margin. LTV helps put that cost in context. The rule of thumb of around 3:1 does not replace a calculation using margin and repeat-purchase data.
A customer who buys three times can contribute more than a one-time buyer. Use demonstrated repeat purchases and a consistent cost basis. Repeat purchases do not automatically reduce the original cost of acquiring a new customer.
The 7 levers at a glance
- Tracking foundation: make events, costs and actual new customers comparable.
- More winning creatives: test new reasons to buy and assess their economic result.
- Sharpen the offer: test conversion rate; with other conditions unchanged, doubling it halves CAC.
- Declutter the funnel: works on the conversion rate, fewer drop-offs in paid traffic.
- Signal quality: check permitted events and values, rather than equating more reports with better buyers.
- Budget allocation: use a consistent cost basis and measure the result of each move.
- LTV view: assess acquisition costs alongside margin and demonstrated repeat purchases.
Worked example: how a CVR jump lowers CAC
Say you spend €10,000 and get 5,000 clicks at a €2 CPC. At a conversion rate of 2 percent that is 100 buyers, so a CAC of €100.
In this hypothetical example, conversion rate rises to 3 percent. With unchanged spend and traffic, that gives 150 buyers and a CAC of around €67, provided all counted buyers are new customers. Same reach, same budget, a third less cost per new customer. The calculation illustrates the conditions; it does not prove the effect of an improved offer.
Case in point: Und Gretel
The published UND GRETEL case describes management across four paid channels and reports over 3,500 orders, a 3.5 blended ROAS and a 38% new-customer share. Those figures alone do not prove lower CAC. That requires new-customer counts and the same defined cost base over a comparison period. The original offer records were not reviewed for this article.
Why knowledge alone doesn't lower CAC
Start with the open question that carries the greatest economic weight. Give it an owner, a budget and a review date. Use the result to decide whether the change stays, needs further testing or should be reversed.
Frequently asked questions
How do I calculate CAC?
CAC = marketing spend ÷ number of new customers in the same period. Include all directly attributable costs, so media budget plus tool and agency costs where relevant, and divide by the new customers won in that time.
What is a good CAC?
Assess CAC alongside contribution margin over the customer relationship. An LTV:CAC ratio of around 3:1 is a rule of thumb, not a universal target. You need reliable margin, repeat-purchase data and a period in which acquisition pays back.
What is the difference between CAC and CPA?
CPA divides the defined cost base by actions or conversions. CAC divides it by actual new customers. In a lead funnel, not every lead becomes a customer. Compare the figures only on the same cost basis and for the same period.
Does a smaller budget lower CAC?
There is no universal answer. A smaller budget changes total costs and may also change the customer mix. Recalculate cost per new customer, then check reach and contribution. Cutting the budget is not itself a result.
How are CAC and LTV connected?
LTV describes value over the customer relationship; CAC describes acquisition cost. Use both with a consistent margin basis and reliable repeat-purchase data. Repeat purchases you only expect do not cover costs today.
How quickly does CAC fall?
There is no fixed deadline. Before the test, define the period, data volume and economic limit needed for your decision. Early movement is not yet a reliable trend.
Conclusion
Start with the cost basis and actual new customers. Review the levers for which you have a specific hypothesis, then measure the result. We handle that ongoing account work. This is how we work.
Where we start
The seven levers pull differently depending on channel and margin. Which one moves first for you is what we settle in growth strategy, before we shift any budget.
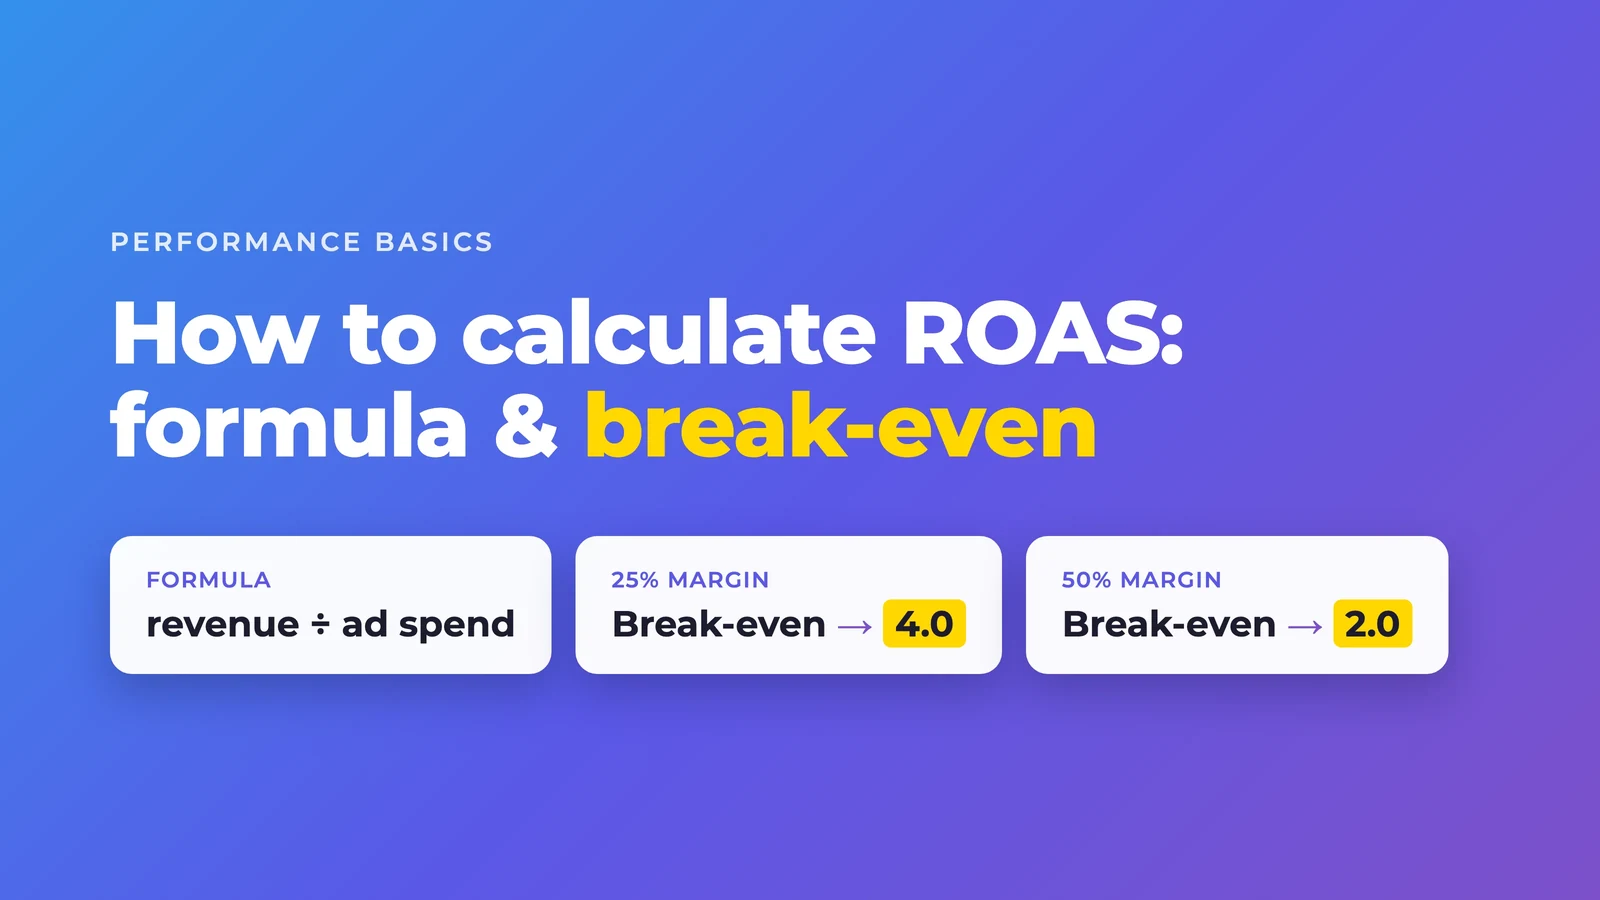
The profit calculator is worth a run first, so you know your break-even.









Klären wir deinen nächsten Schritt zusammen
Let’s work out your next step together